

Question: Using the values you found for b 0 and b 1 and, calculate Y predicted values for each X value, andplot the regression line (X
Using the values you found for b0and b1and, calculate Y predicted values for each X value, andplot the regression line (X by Ypred).
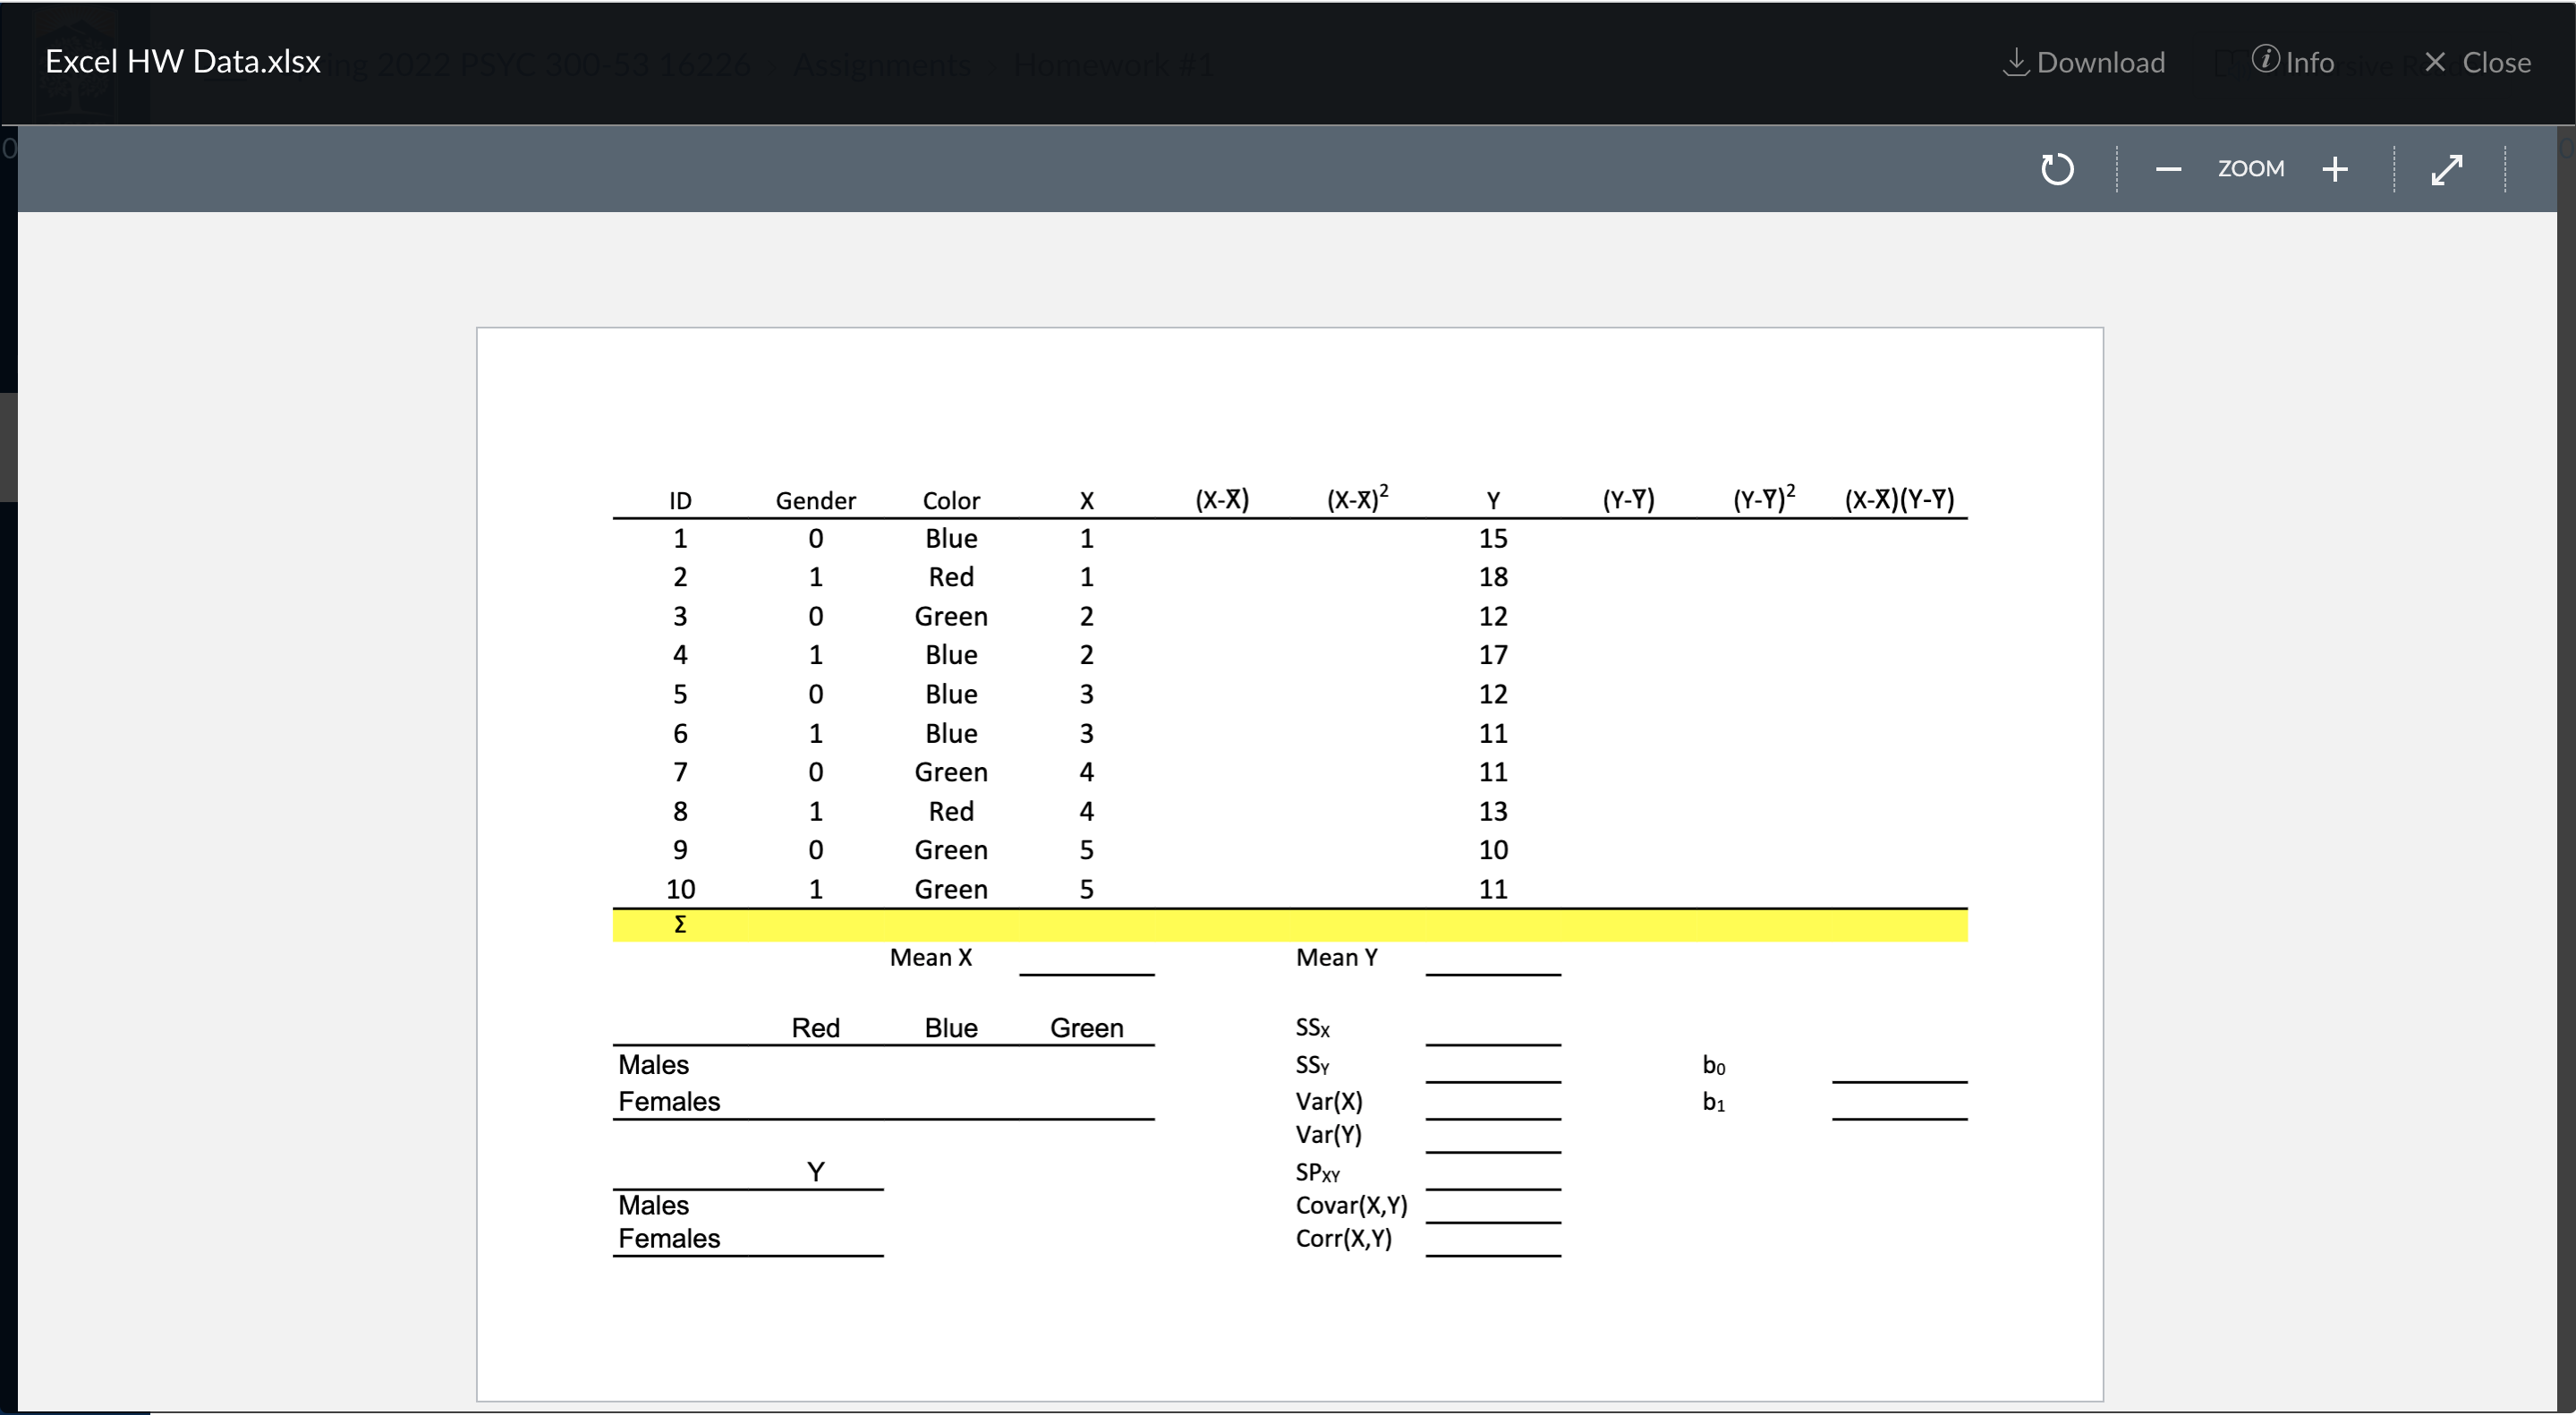
Download i Info X Close Excel HW Data.xIsx ZOOM + K7 Gender Color (X-X) ( X-x) 2 Y ( Y-Y ) (Y- Y ) 2 ( X- X ) ( Y- Y ) O Blue 15 Red 18 Green 12 WW N N H P X Blue 17 Blue 12 MOLDO VOUTAWNEE Blue 11 Green 11 Red 13 UTUIAD OH Green 10 Green 11 Mean X Mean Y Red Blue Green SSx Males SSY Females Var(X) Var(Y) Y SPXY Males Covar(X,Y) Females Corr(X, Y)
Step by Step Solution
There are 3 Steps involved in it
1 Expert Approved Answer
Step: 1 Unlock

Question Has Been Solved by an Expert!
Get step-by-step solutions from verified subject matter experts
Step: 2 Unlock
Step: 3 Unlock