Question: Using the various important concepts examined throughout this semester , describe and explain the general geographical patterns of average annual snowfall across the United States.
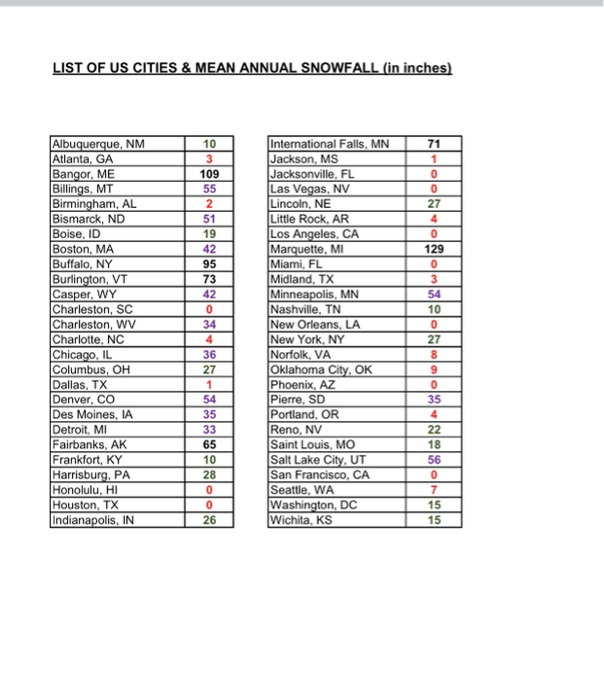
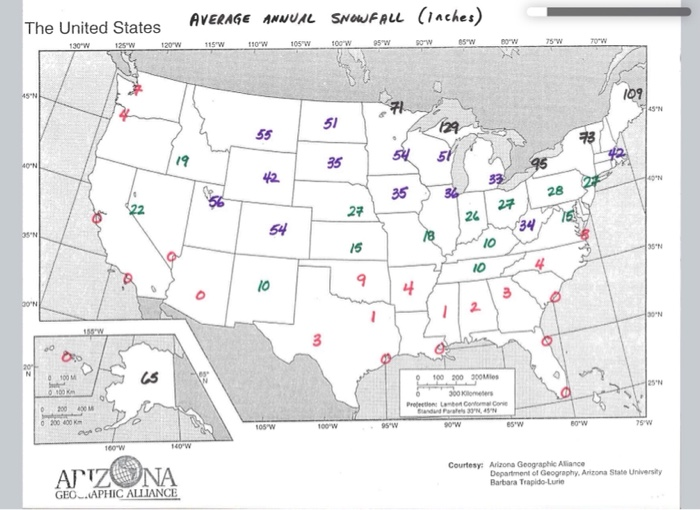
Using the various important concepts examined throughout this semester, describe and explain the general geographical patterns of average annual snowfall across the United States. As with the preceding research exercise, the discussion ought to be centered on the regions or sub-regions of the U.S. (e.g., a group of cities in the Southeast). Hence, please do not discuss each individualcity displayed on the map; it is more appropriate to refer to the cities only as examples. Word length 500 words. LIST OF US CITIES & MEAN ANNUAL SNOWFALL (in inches) 10 3 109 55 2 51 19 42 95 73 Albuquerque, NM Atlanta, GA Bangor, ME Billings, MT Birmingham, AL Bismarck, ND Boise, ID Boston, MA Buffalo, NY Burlington, VT Casper, WY Charleston, SC Charleston, WV Charlotte, NC Chicago, IL Columbus, OH Dallas, TX Denver, CO Des Moines, IA Detroit, MI Fairbanks, AK Frankfort, KY Harrisburg, PA Honolulu, HI Houston, TX Indianapolis, IN R-L03 42 International Falls, MN Jackson, MS Jacksonville, FL Las Vegas, NV Lincoln, NE Little Rock, AR Los Angeles, CA Marquette, MI Miami, FL Midland, TX Minneapolis, MN Nashville, TN New Orleans, LA New York, NY Norfolk, VA Oklahoma City, OK Phoenix, AZ Pierre, SD Portland, OR Reno, NV Saint Louis, MO Salt Lake City, UT San Francisco, CA Seattle, WA Washington, DC Wichita, KS 1 0 0 27 4 0 129 0 3 54 10 0 27 8 9 0 34 4 36 27 1 54 35 33 65 10 28 0 0 26 35 4 22 18 56 0 7 15 15 The United States AVERAGE ANNUAL SNOWFALL (inches) 25W 120 W 115 W 110 W 105W 130 W 100W go w 125 W 65W 75 W 70 W BOW X 45'N 109 7145 51 55 124 73 19 AON 35 54 51 96 42 33 ON 35 36 28 27 27 24 54 34 ON 18 15 10 995 SON 10 4 . 10 9 4. 3 BO'N SON 3 N 100M 019 65 100 300M 300 25'N Pro 0 30000 100 W 95'w 90W 105 W es'w so'w 75 W 160W 10W ATIZUNA Courtesy: Arizona Geographie Alliance Department of Geography, Arizona State University Barbara Trapido-curio GEO..APHIC ALLIANCE LIST OF US CITIES & MEAN ANNUAL SNOWFALL (in inches) 10 3 109 55 2 51 19 42 95 73 Albuquerque, NM Atlanta, GA Bangor, ME Billings, MT Birmingham, AL Bismarck, ND Boise, ID Boston, MA Buffalo, NY Burlington, VT Casper, WY Charleston, SC Charleston, WV Charlotte, NC Chicago, IL Columbus, OH Dallas, TX Denver, CO Des Moines, IA Detroit, MI Fairbanks, AK Frankfort, KY Harrisburg, PA Honolulu, HI Houston, TX Indianapolis, IN R-L03 42 International Falls, MN Jackson, MS Jacksonville, FL Las Vegas, NV Lincoln, NE Little Rock, AR Los Angeles, CA Marquette, MI Miami, FL Midland, TX Minneapolis, MN Nashville, TN New Orleans, LA New York, NY Norfolk, VA Oklahoma City, OK Phoenix, AZ Pierre, SD Portland, OR Reno, NV Saint Louis, MO Salt Lake City, UT San Francisco, CA Seattle, WA Washington, DC Wichita, KS 1 0 0 27 4 0 129 0 3 54 10 0 27 8 9 0 34 4 36 27 1 54 35 33 65 10 28 0 0 26 35 4 22 18 56 0 7 15 15 The United States AVERAGE ANNUAL SNOWFALL (inches) 25W 120 W 115 W 110 W 105W 130 W 100W go w 125 W 65W 75 W 70 W BOW X 45'N 109 7145 51 55 124 73 19 AON 35 54 51 96 42 33 ON 35 36 28 27 27 24 54 34 ON 18 15 10 995 SON 10 4 . 10 9 4. 3 BO'N SON 3 N 100M 019 65 100 300M 300 25'N Pro 0 30000 100 W 95'w 90W 105 W es'w so'w 75 W 160W 10W ATIZUNA Courtesy: Arizona Geographie Alliance Department of Geography, Arizona State University Barbara Trapido-curio GEO..APHIC ALLIANCE