

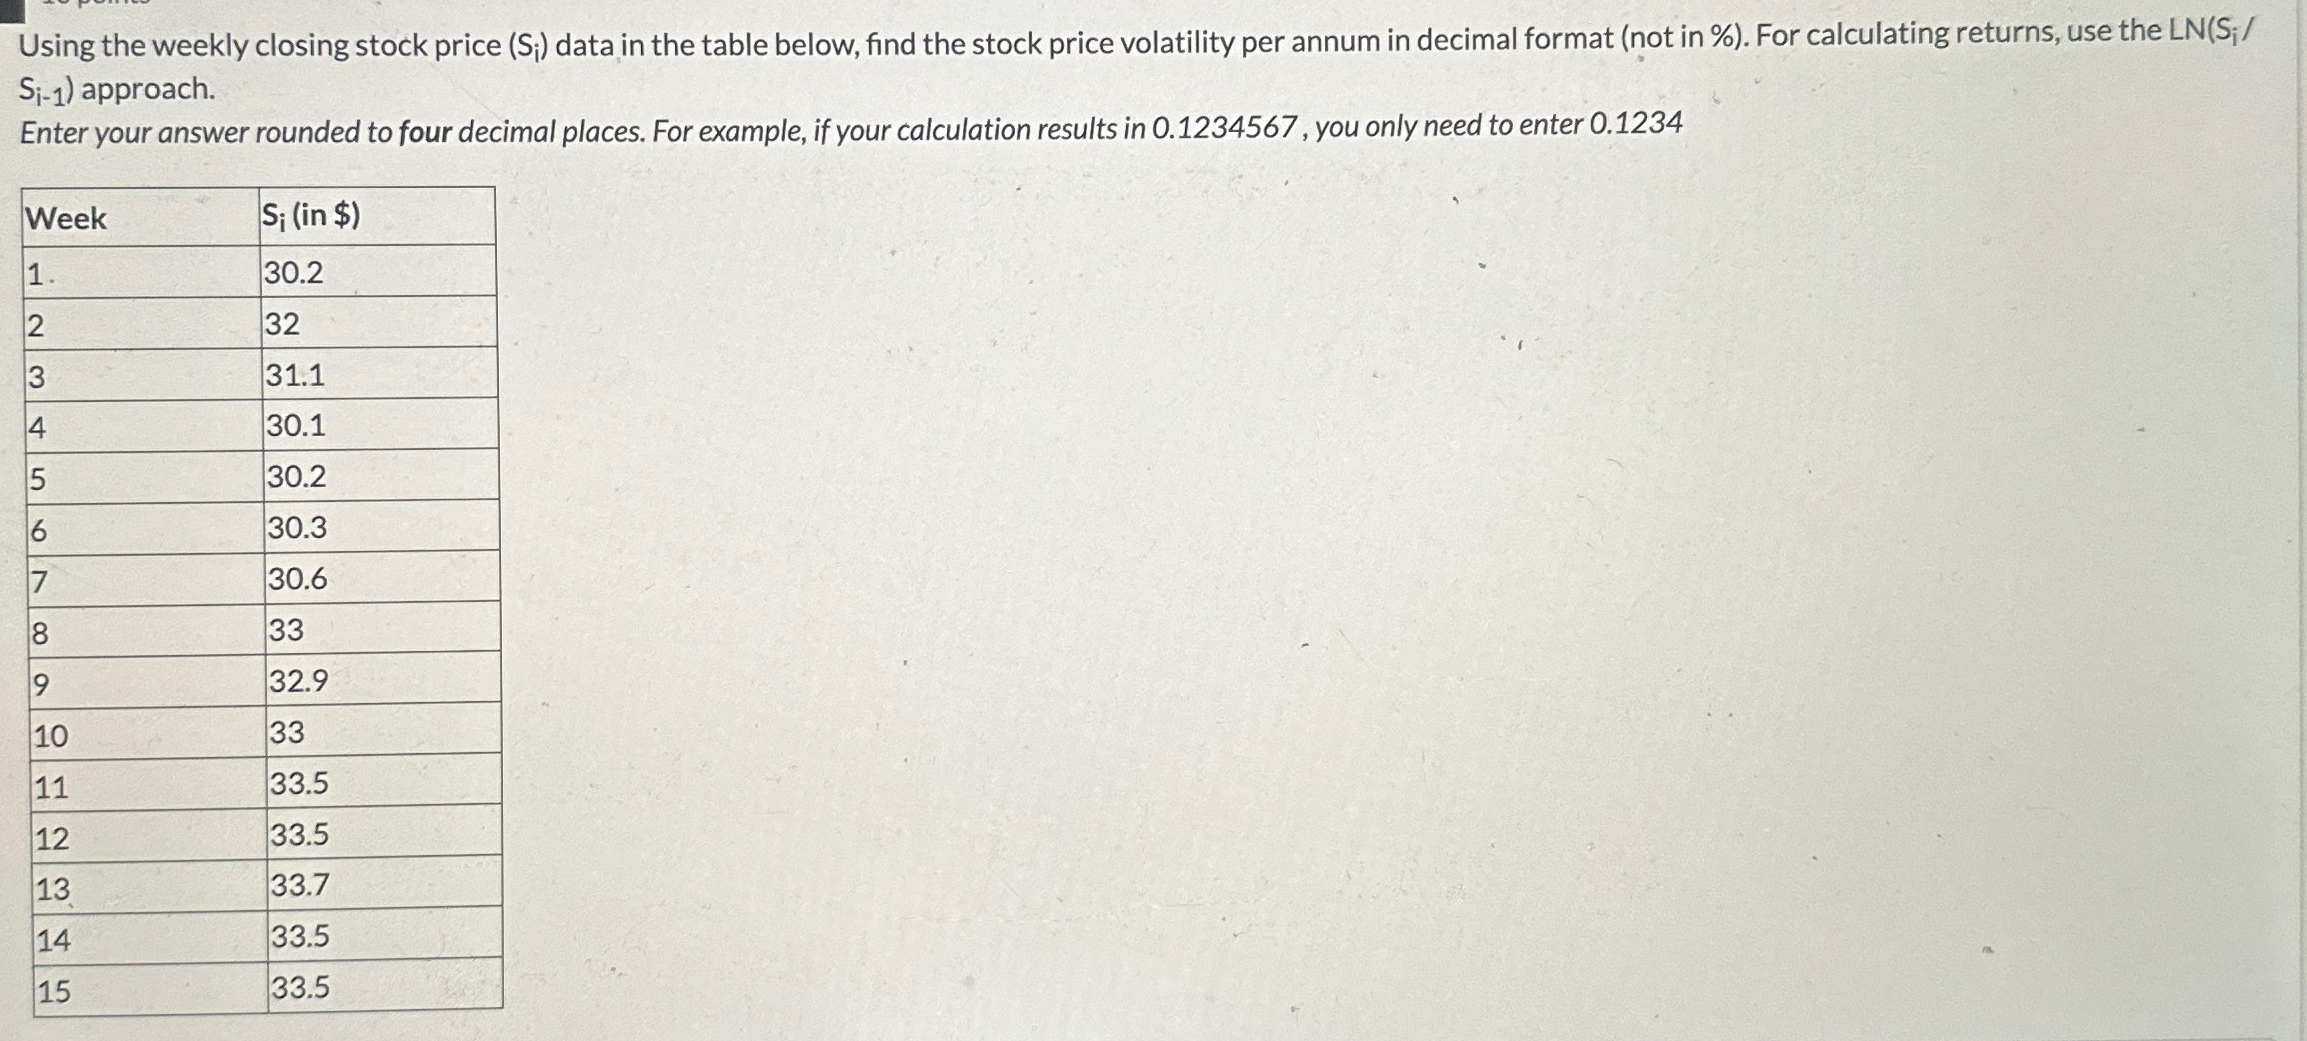
Question: Using the weekly closing stock price ( S i ) data in the table below, find the stock price volatility per annum in decimal format
Using the weekly closing stock price data in the table below, find the stock price volatility per annum in decimal format not in For calculating returns, use the approach.
Enter your answer rounded to four decimal places. For example, if your calculation results in you only need to enter
tableWeekin $
Step by Step Solution
There are 3 Steps involved in it
1 Expert Approved Answer
Step: 1 Unlock

Question Has Been Solved by an Expert!
Get step-by-step solutions from verified subject matter experts
Step: 2 Unlock
Step: 3 Unlock