

Question: Using these numbers 1) Download Microsoft Balance sheet, Income statement, and Cash flow statement from the FINRA- Morningstar e website. 2) Create a spreadsheet that
Using these numbers
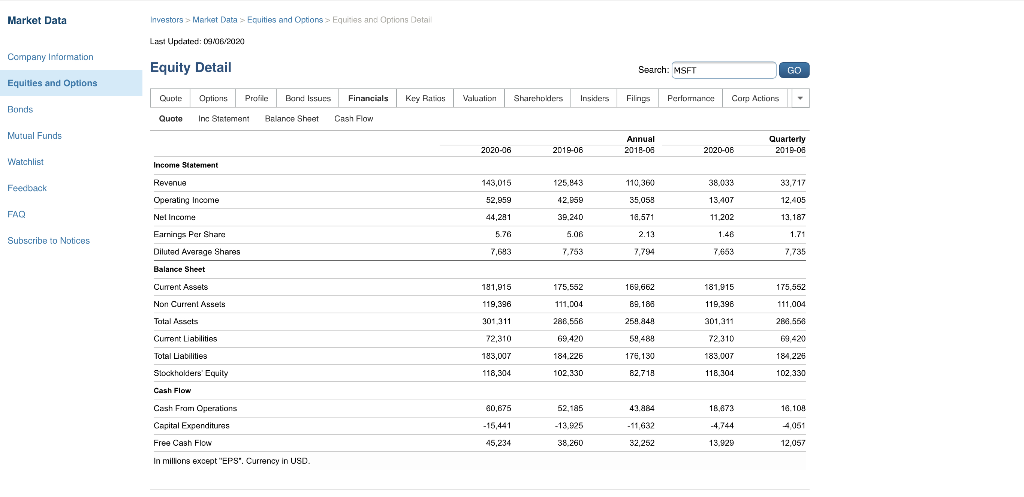
1) Download Microsoft Balance sheet, Income statement, and Cash flow statement from the FINRA- Morningstar e website. 2) Create a spreadsheet that has a tab for each of these THREE statements. *** THE EASIEST WAY TO DO THIS IS A. SAVE EACH OF THE FILES. B. OPEN EXCEL -- AND C. FROM WITHIN EXCEL, OPEN EACH OF THE FILES YOU DOWNLOADED AND SAVED. D. PUT EACH OF THEM INTO A SINGLE SPREADSHEET (THREE TABS) E. SAVE THE FINAL AS A SPREADSHEET -- NOT A CSV FILE. 3) On a FOURTH tab in your spreadsheet, calculate Microsoft's Return on Equity (ROE) the year ending June 2020 -- Net income / Equity** ****MAKE SURE YOU USE CELL REFERENCES TO DO THIS -- FROM THE OTHER TABS -- DO NOT SIMPLY USE NUMBERS HERE. 4) Show the following components of their ROE and how they combine to create the ROE A. Net Income Margin --> NI/Sales B. Asset Turnover --> Sales/Assets** C. Financial Leverage ---> Assets/Equity** NOTE: (for BOTH Assets and Equity, use the AVERAGE of the year end numbers from 2020 and 2019) -- NOT just the beginning of the year (2019/06) or the end of the year (2020/06) ****MAKE SURE YOU USE CELL REFERENCES TO DO THIS -- FROM THE OTHER TABS -- DO NOT SIMPLY USE NUMBERS HERE. 5) Look up the ROE number calculated by the FINRA people under the "Key Ratios" tab. Is this number the same as what you got? Make sure it is. Market Data Investors > Market Data > Equities and Options > Equities and Options Detail Last Updated: 09/16/2020 Company Information Equity Detail Search: MSFT GO Equities and Options Quote Options Pratic Band Issues Financials Key Ratics Valuation Shareholders Insiders Filings Performance Care Actions Bonds Quote Inc Statement Balance Sheet Cash Flow Mutual Funds Annual 2013-08 Quarterly 2015-08 2020-06 2019-06 2020-06 Watchlist Income Statement Revenue 125.843 110,360 38 033 Feedback 33.717 143,015 52,959 42.959 35,058 13.407 12.405 FAQ 44,281 39,240 18,571 11,202 13.187 5.76 5.08 2.13 1.48 1.71 Subscribe to Notices 7,693 7.663 7,735 Operating Income Nel Income Earnings Per Sharc Diluted Average Shares Balance Sheet Current Assets Non Current Assets Total Assets Current Liabilities 175,552 169,662 181.915 181,915 119,396 175,552 111,004 89.188 111,004 288,568 301 311 258.848 119,396 301.311 72,310 288.558 72,310 69 420 59 489 69 420 183,007 178,130 183.007 184,226 Total Liabilities Stockholders' Equity 184.226 102.330 118,304 82.710 118,304 102.330 Cash Flow 52, 125 16,873 18.108 Cash From Operations Capital Expenditures Free Cash Flow 80,675 -15,441 -13.925 43.884 - 11632 32,252 -4.744 4051 45,234 38.260 13.929 12,057 In millions except "EPS". Currency in USD 1) Download Microsoft Balance sheet, Income statement, and Cash flow statement from the FINRA- Morningstar e website. 2) Create a spreadsheet that has a tab for each of these THREE statements. *** THE EASIEST WAY TO DO THIS IS A. SAVE EACH OF THE FILES. B. OPEN EXCEL -- AND C. FROM WITHIN EXCEL, OPEN EACH OF THE FILES YOU DOWNLOADED AND SAVED. D. PUT EACH OF THEM INTO A SINGLE SPREADSHEET (THREE TABS) E. SAVE THE FINAL AS A SPREADSHEET -- NOT A CSV FILE. 3) On a FOURTH tab in your spreadsheet, calculate Microsoft's Return on Equity (ROE) the year ending June 2020 -- Net income / Equity** ****MAKE SURE YOU USE CELL REFERENCES TO DO THIS -- FROM THE OTHER TABS -- DO NOT SIMPLY USE NUMBERS HERE. 4) Show the following components of their ROE and how they combine to create the ROE A. Net Income Margin --> NI/Sales B. Asset Turnover --> Sales/Assets** C. Financial Leverage ---> Assets/Equity** NOTE: (for BOTH Assets and Equity, use the AVERAGE of the year end numbers from 2020 and 2019) -- NOT just the beginning of the year (2019/06) or the end of the year (2020/06) ****MAKE SURE YOU USE CELL REFERENCES TO DO THIS -- FROM THE OTHER TABS -- DO NOT SIMPLY USE NUMBERS HERE. 5) Look up the ROE number calculated by the FINRA people under the "Key Ratios" tab. Is this number the same as what you got? Make sure it is. Market Data Investors > Market Data > Equities and Options > Equities and Options Detail Last Updated: 09/16/2020 Company Information Equity Detail Search: MSFT GO Equities and Options Quote Options Pratic Band Issues Financials Key Ratics Valuation Shareholders Insiders Filings Performance Care Actions Bonds Quote Inc Statement Balance Sheet Cash Flow Mutual Funds Annual 2013-08 Quarterly 2015-08 2020-06 2019-06 2020-06 Watchlist Income Statement Revenue 125.843 110,360 38 033 Feedback 33.717 143,015 52,959 42.959 35,058 13.407 12.405 FAQ 44,281 39,240 18,571 11,202 13.187 5.76 5.08 2.13 1.48 1.71 Subscribe to Notices 7,693 7.663 7,735 Operating Income Nel Income Earnings Per Sharc Diluted Average Shares Balance Sheet Current Assets Non Current Assets Total Assets Current Liabilities 175,552 169,662 181.915 181,915 119,396 175,552 111,004 89.188 111,004 288,568 301 311 258.848 119,396 301.311 72,310 288.558 72,310 69 420 59 489 69 420 183,007 178,130 183.007 184,226 Total Liabilities Stockholders' Equity 184.226 102.330 118,304 82.710 118,304 102.330 Cash Flow 52, 125 16,873 18.108 Cash From Operations Capital Expenditures Free Cash Flow 80,675 -15,441 -13.925 43.884 - 11632 32,252 -4.744 4051 45,234 38.260 13.929 12,057 In millions except "EPS". Currency in USD
Step by Step Solution
There are 3 Steps involved in it

Get step-by-step solutions from verified subject matter experts