

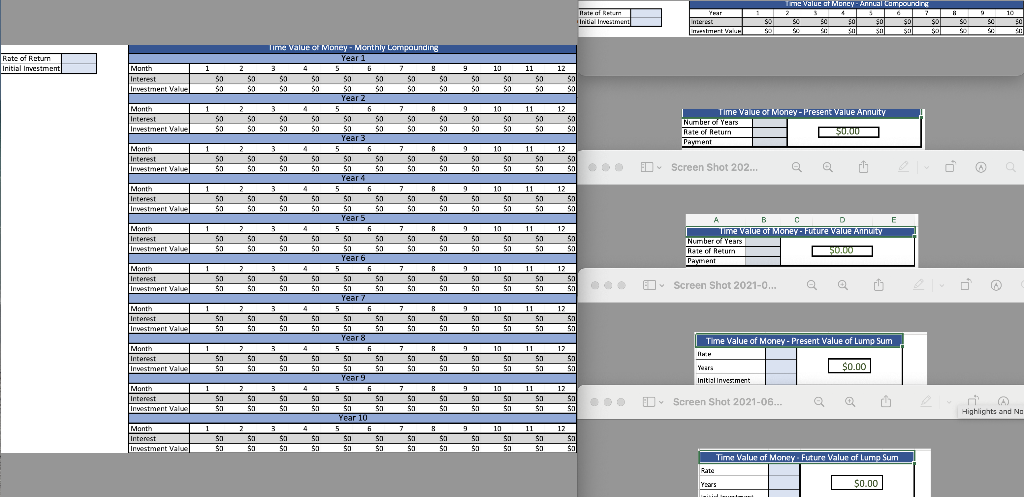
Question: Using the Project Two Financial Formulas spreadsheet and the balance sheet, income statement, and cash flow statement from Mergent Online for your chosen company, calculate
Using the Project Two Financial Formulas spreadsheet and the balance sheet, income statement, and cash flow statement from Mergent Online for your chosen company, calculate the financial ratios for the most recent fiscal quarter. Then, compare those ratios with the same ratios for the same fiscal quarter from one year prior in Mergent Online, and analyze your results.
Specifically, you must address the following rubric criteria:
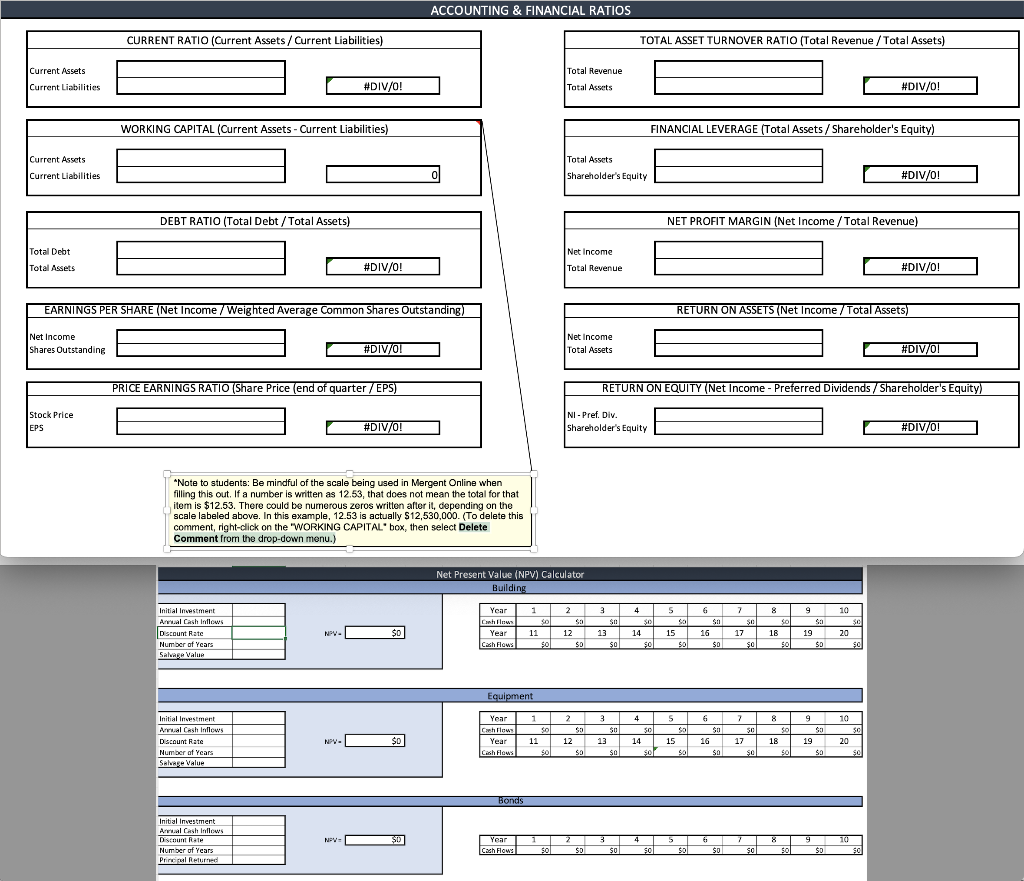
- Financial Calculations: Calculate accurate financial ratios to assess the businesss current financial health. Specifically, calculate the following ratios:
- Working capital
- Current ratio
- Debt ratio
- Earnings per share
- Price/earnings ratio
- Total asset turnover ratio
- Financial leverage
- Net profit margin
- Return on assets
- Return on equity
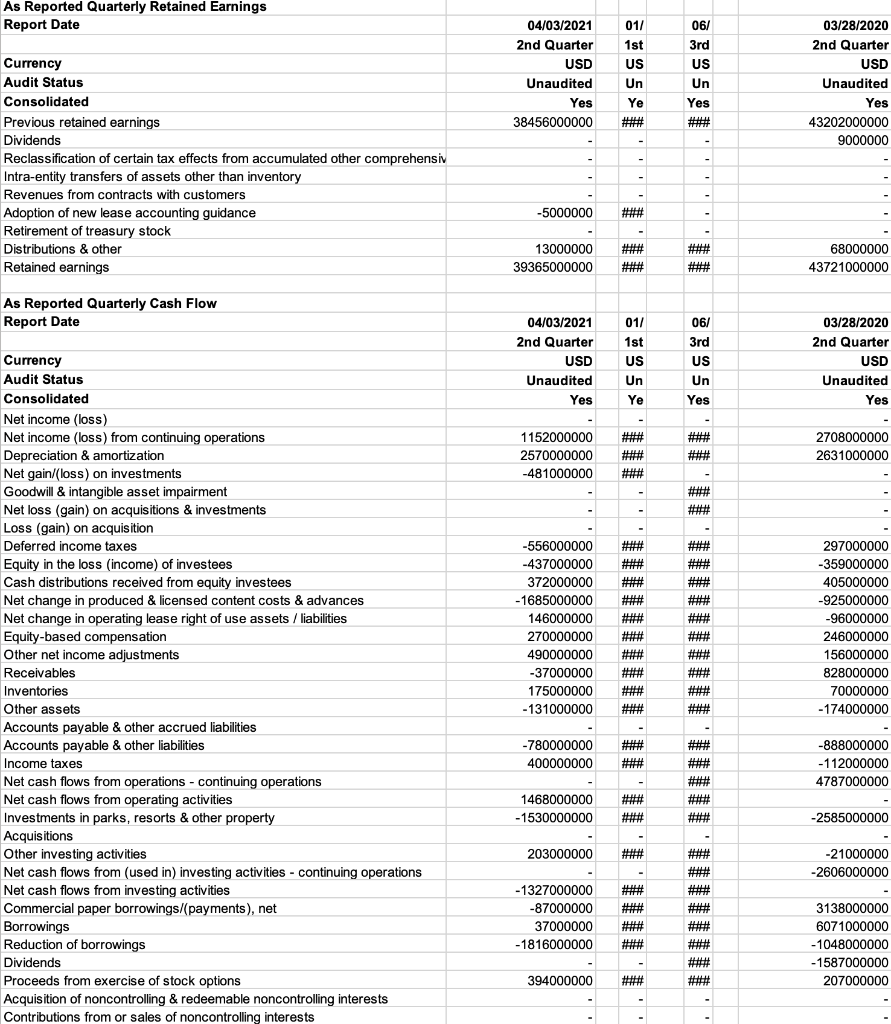
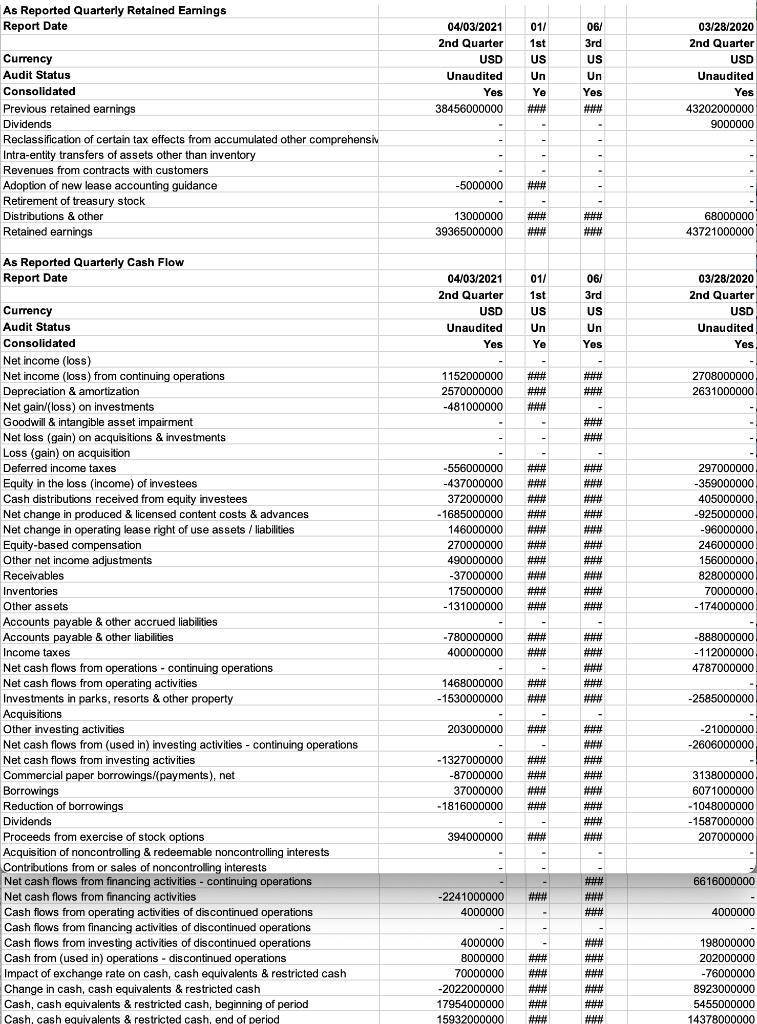
- Fiscal Quarter Comparison: Using Mergent Online, summarize the differences between the results from your financial calculations of the most recent fiscal quarter and the results of the same financial calculations of the same fiscal quarter from a year before for your chosen business.
- For example, if the most recent fiscal quarter available is the 3rd quarter in 2020, then you will compare those results to the same financial calculations from the 3rd quarter in 2019.
- Comparison Analysis: Explain what the results of your calculations and your comparison indicate about the businesss current financial health, providing examples to support your explanation. You might consider the following questions:
- Do the results indicate the business is financially healthy or financially unhealthy? Which results indicate this?
- What might be the cause(s) of the businesss financial success or failure?
- Is more information needed to determine the businesss financial health? If so, which pieces of information might still be needed?
- Short-Term Financing: Explain how potential short-term financing sources could help the business raise needed funds to improve its financial health. Base your response on the businesss current financial information. *I would appreciate ANY and ALL help as my numbers aren't matching up to make sense! Thank you!* This is for Disney Q2. I'm including the statements from Mergent Online but there is another good one here with some more information: https://stockanalysis.com/stocks/dis/financials/balance-sheet/?period=quarterly
-
YRAT 2 10 Hair Rem Initalnement Ime value of Money Annual Compounding 5 SC 50 $0 01 $1 $21 $0 SO so SC 50 Interest THVL Time Value of Money Monthly Compounding Year 1 Rate of Return Initial Investment 1 2 4 5 5 7 9 9 10 Month interest Investment Valur $0 $0 SC $0 $0 So $0 So $0 $0 $0 SE $3 Sa $0 $3 11 12 $3 $31 $0 sa SO $0 $3 Year 2 5 6 1 2 3 4 7 B Month interest Investment Value 50 $2 $2 $3 $2 $2 $0 50 9 9 10 11 12 $ $31 $0 $0 $0 $o $3 $0 50 $0 $0 $0 $0 $0 Time Value of Money - Present Value Annuity Number Years Rate of Return $0.00 Paytrent 1 2 3 4 7 B Month interest Investment Value $0 $0 Year 3 5 6 $0 $3 $3 $0 Year 4 $3 $0 $3 $3 $0 $3 $3 $3 $3 $0 50 $3 9 10 11 12 50 $3 $0 $0 $3 $0 $0 $0 D Screen Shot 202... e Month 1 2 3 4 5 6 7 R 9 10 11 12 interest Investment Value $0 $0 1. $0 $ $0 $ $0 63 $0 Year 5 63 $0 1] $0 $0 $0 $0 $0 $0 $0 1] $0 1 $0 $0 B C D E Month 1 2 3 4 5 6 7 R Interest $a $a $0 $a $0 $a $0 $0 $0 $a Year 6 $0 $3 $0 $a $0 $a 9 10 11 12 $2 $0 $0 $a $a $a $a $3 Investment Value Time Value of Money - Future Value Annuity Number of Years Rate of Return $0.00 Paytrent Month 1 2 3 4 5 61 7 R 9 11 12 $0 Interest Investment Value $a $ $0 $ $0 $ $a $ $a $ Year 7 $a $ $a $a $a $a 10 $a $a $a $ $0 $ ED Screen Shot 2021-0... 1 2 3 4 5 51 7 R 10 11 12 Month Interest Investment Value $a $3 $0 $a $a $a $a $a $0 $ Year 8 $a $ $a ta $a $a $a $a $a $a $a $ $a $a Time Value of Money - Present Value of Lump Sum 1 2 3 4 5 51 7 R 9 IHH Month Interest Investment Value $a $a $a $a $a $a $a $a $a $a Year $a $a $a $a $a $a $a $a 10 11 12 $a $a $a $a $a $a Years $0.00 Initial Invesment Manth 1 2 3 4 5 6 7 R 9 19 11 12 Interest Investment Value $a $21 $a $a $a $a $a $a $a $a Year 10 $a $a $a $a $a $ $a $a $a $a $a $a $a $a I Screen Shot 2021-06... Highlights and No 1 2 3 4 5 5 7 B 9 Manth Interest mert $a $a $a $a $11 $a $a $a $a $a $11 $a $a $3 $a $a $21 $a 10 11 12 $a $a $a $a $a $a Time Value of Money. Future Value of Lump Sum Rate Years $0.00 ACCOUNTING & FINANCIAL RATIOS CURRENT RATIO (Current Assets / Current Liabilities) TOTAL ASSET TURNOVER RATIO (Total Revenue / Total Assets) Current Assets Total Revenue Current Liabilities #DIV/0! Total Assets #DIV/01 WORKING CAPITAL (Current Assets - Current Liabilities) FINANCIAL LEVERAGE (Total Assets / Shareholder's Equity) Current Assets Total Assets Shareholder's Equity Current Liabilities #DIV/0! DEBT RATIO (Total Debt/Total Assets) NET PROFIT MARGIN (Net Income /Total Revenue) Total Debt Net Income Total Assets #DIV/0! Total Revenue #DIV/0! EARNINGS PER SHARE (Net Income / Weighted Average Common Shares Outstanding, RETURN ON ASSETS (Net Income / Total Assets) Net Income Net Income Total Assets Shares Outstanding #DIV/0! #DIV/01 PRICE EARNINGS RATIO (Share Price (end of quarter/EPS) RETURN ON EQUITY (Net Income - Preferred Dividends/Shareholder's Equity) Stock Price NI - Pref. Div. Shareholder's Equity EPS #DIV/0! #DIV/0! *Note to students: Be mindful of the scale being used in Mergent Online when filling this out. If a number is written as 12.53, that does not mean the total for that item is $12.53. There could be numerous zeros written after it, depending on the scale labeled above. In this example, 12.53 is actually $12,530,000. (To delete this comment, right-click on the "WORKING CAPITAL" box, then select Delete Comment from the drop-down menu.) Net Present Value (NPV) Calculator Building 1 3 4 5 6 7 9 10 S11 30 2 Sa 12 $n Initial Investment Annual Cash Intlows Discount Rate Number of Years Salvage Value Sa Year Conhows Year Cash Flows So 11 NPV- $0 13 14 15 16 17 SO 18 $0 19 20 501 SO $o $0 50 $ $0 so SO so Equipment Initial Investment Year 1 3 4 5 6 7 9 Cashflows $9 50 $0 $a Annual Cash Inflows Discount Rate $0 16 10 SC 20 NPV- $0 Year 11 12 13 15 17 18 19 14 sor Number of Years Cash Flows $0 SO sal SO SO Salvage Value Bonds Initial Investment Arr Cashindows Discount Rate Number of Years Princ Return NPV: Year 1 2 3 4 5 61 7 8 9 10 Cash Flows sol SD $0 $0 $0 $0 so sol $0 50 As Reported Quarterly Retained Earnings Report Date 04/03/2021 011 06/ 03/28/2020 2nd Quarter 1st 3rd 2nd Quarter USD US US USD Currency Audit Status Unaudited Un Un Unaudited Consolidated Yes Ye Yes Yes 38456000000 ### 43202000000 9000000 Previous retained earnings Dividends Reclassification of certain tax effects from accumulated other comprehensiv Intra-entity transfers of assets other than inventory Revenues from contracts with customers - -5000000 ### Adoption of new lease accounting guidance Retirement of treasury stock Distributions & other 13000000 WE ATTIT 68000000 Retained earnings 39365000000 ### 43721000000 As Reported Quarterly Cash Flow Report Date 04/03/2021 01/ 06/ 03/28/2020 2nd Quarter 1st 3rd 2nd Quarter USD US US USD Currency Audit Status Unaudited Un Un Unaudited Consolidated Yes Ye Yes Yes 1152000000 2708000000 2631000000 2570000000 HHH ### -481000000 ### #t ### Net income (loss) Net income (loss) from continuing operations Depreciation & amortization Net gain/(loss) on investments Goodwill & intangible asset impairment Net loss (gain) on acquisitions & investments Loss (gain) on acquisition Deferred income taxes Equity in the loss (income) of investees Cash distributions received from equity investees Net change in produced & licensed content costs & advances Net change in operating lease right of use assets / liabilities Equity-based compensation Other net income adjustments Receivables ### #*** -556000000 -437000000 372000000 - 1685000000 146000000 297000000 -359000000 405000000 ### -925000000 ### ### -96000000 270000000 246000000 490000000 ### ### 156000000 -37000000 ### 828000000 175000000 ### 70000000 -174000000 -131000000 ### if it -780000000 ### ### 400000000 ### -888000000 - 112000000 4787000000 1468000000 ### ### ### -1530000000 ### -2585000000 Inventories Other assets Accounts payable & other accrued liabilities Accounts payable & other liabilities Income taxes Net cash flows from operations - continuing operations Net cash flows from operating activities Investments in parks, resorts & other property Acquisitions Other investing activities Net cash flows from (used in) investing activities - continuing operations Net cash flows from investing activities Commercial paper borrowings/(payments), net Borrowings Reduction of borrowings Dividends Proceeds from exercise of stock options Acquisition of noncontrolling & redeemable noncontrolling interests Contributions from or sales of noncontrolling interests 203000000 ### -21000000 -2606000000 -1327000000 ### -87000000 ### ### 3138000000 37000000 ### ### 6071000000 -1816000000 ### ### -1048000000 - 1587000000 207000000 394000000 As Reported Quarterly Retained Earnings Report Date 04/03/2021 01/ 06/ 03/28/2020 1st 3rd 2nd Quarter 2nd Quarter USD US US USD Unaudited Un Un Unaudited Yes Yes Ye Yes 38456000000 ### #** 43202000000 9000000 Currency Audit Status Consolidated Previous retained earnings Dividends Reclassification of certain tax effects from accumulated other comprehensiv Intra-entity transfers of assets other than inventory Revenues from contracts with customers Adoption of new lease accounting guidance Retirement of treasury stock Distributions & other Retained earnings -5000000 HE HT HH THE 68000000 13000000 39365000000 ### ### 43721000000 As Reported Quarterly Cash Flow Report Date 01/ 06/ 03/28/2020 04/03/2021 2nd Quarter USD 1st 3rd 2nd Quarter US US USD Currency Audit Status Unaudited Un Un Unaudited Consolidated Yes Ye Yes Yes ALLAH MHR 1152000000 2570000000 -481000000 2708000000 2631000000 ### ### ### HH HA #*** -556000000 HE HAT TH HAT -437000000 HU HI ri 297000000 -359000000 405000000 -925000000 372000000 ### APP HT ### ### ### -96000000 ### ### ### 246000000 -1685000000 0.000000 146000000 270000000 490000000 -37000000 175000000 -131000000 ### HH 156000000 # ### 828000000 ### ### 70000000 ### HT - 174000000 -780000000 ### 400000000 ### HI -888000000 - 112000000 4787000000 ### 1468000000 ### ### Net income (loss) Net income (loss) from continuing operations Depreciation & amortization Net gain (loss) on investments Goodwill & intangible asset impairment Net loss (gain) on acquisitions & investments Loss (gain) on acquisition Deferred income taxes Equity in the loss (income) of investees Cash distributions received from equity investees Net change in produced & licensed content costs & advances Net change in operating lease right of use assets / liabilities Equity-based compensation Other net income adjustments Boccus Receivables Invento Inventories Oth Other assets Accounts payable & other accrued liabilities Accounts payable & other liabilities Income taxes Net cash flows from operations - continuing operations Net cash flows from operating activities Investments in parks, resorts & other property Acquisitions Other investing activities Net cash flows from (used in) investing activities - continuing operations Net cash flows from investing activities Commercial paper borrowings/payments), net Borrowings Reduction of borrowings Dividends Proceeds from exercise of stock options Acquisition of noncontrolling & redeemable noncontrolling interests Contributions from or sales of noncontrolling interests Net cash flows from financing activities - continuing operations Net cash flows from financing activities Cash flows from operating activities of discontinued operations Cash flows from financing activities of discontinued operations Cash flows from investing activities of discontinued operations Cash from (used in) operations - discontinued operations Impact of exchange rate on cash, cash equivalents & restricted cash Change in cash, cash equivalents & restricted cash Cash, cash equivalents & restricted cash, beginning of period Cash, cash equivalents & restricted cash, end of period - 1530000000 ### #*** -2585000000 203000000 ### TH AT IT -21000000 -2606000000 -1327000000 ### #*** ### ## w #* ### -87000000 37000000 -1816000000 3138000000 6071000000 ### HAH -1048000000 THE - 1587000000 394000000 #*** 207000000 6616000000 -2241000000 4000000 4000000 ### 198000000 4000000 8000000 ### ### 202000000 70000000 -76000000 ### ### ### ### -2022000000 8923000000 17954000000 ### ### 5455000000 14378000000 15932000000 ### ### YRAT 2 10 Hair Rem Initalnement Ime value of Money Annual Compounding 5 SC 50 $0 01 $1 $21 $0 SO so SC 50 Interest THVL Time Value of Money Monthly Compounding Year 1 Rate of Return Initial Investment 1 2 4 5 5 7 9 9 10 Month interest Investment Valur $0 $0 SC $0 $0 So $0 So $0 $0 $0 SE $3 Sa $0 $3 11 12 $3 $31 $0 sa SO $0 $3 Year 2 5 6 1 2 3 4 7 B Month interest Investment Value 50 $2 $2 $3 $2 $2 $0 50 9 9 10 11 12 $ $31 $0 $0 $0 $o $3 $0 50 $0 $0 $0 $0 $0 Time Value of Money - Present Value Annuity Number Years Rate of Return $0.00 Paytrent 1 2 3 4 7 B Month interest Investment Value $0 $0 Year 3 5 6 $0 $3 $3 $0 Year 4 $3 $0 $3 $3 $0 $3 $3 $3 $3 $0 50 $3 9 10 11 12 50 $3 $0 $0 $3 $0 $0 $0 D Screen Shot 202... e Month 1 2 3 4 5 6 7 R 9 10 11 12 interest Investment Value $0 $0 1. $0 $ $0 $ $0 63 $0 Year 5 63 $0 1] $0 $0 $0 $0 $0 $0 $0 1] $0 1 $0 $0 B C D E Month 1 2 3 4 5 6 7 R Interest $a $a $0 $a $0 $a $0 $0 $0 $a Year 6 $0 $3 $0 $a $0 $a 9 10 11 12 $2 $0 $0 $a $a $a $a $3 Investment Value Time Value of Money - Future Value Annuity Number of Years Rate of Return $0.00 Paytrent Month 1 2 3 4 5 61 7 R 9 11 12 $0 Interest Investment Value $a $ $0 $ $0 $ $a $ $a $ Year 7 $a $ $a $a $a $a 10 $a $a $a $ $0 $ ED Screen Shot 2021-0... 1 2 3 4 5 51 7 R 10 11 12 Month Interest Investment Value $a $3 $0 $a $a $a $a $a $0 $ Year 8 $a $ $a ta $a $a $a $a $a $a $a $ $a $a Time Value of Money - Present Value of Lump Sum 1 2 3 4 5 51 7 R 9 IHH Month Interest Investment Value $a $a $a $a $a $a $a $a $a $a Year $a $a $a $a $a $a $a $a 10 11 12 $a $a $a $a $a $a Years $0.00 Initial Invesment Manth 1 2 3 4 5 6 7 R 9 19 11 12 Interest Investment Value $a $21 $a $a $a $a $a $a $a $a Year 10 $a $a $a $a $a $ $a $a $a $a $a $a $a $a I Screen Shot 2021-06... Highlights and No 1 2 3 4 5 5 7 B 9 Manth Interest mert $a $a $a $a $11 $a $a $a $a $a $11 $a $a $3 $a $a $21 $a 10 11 12 $a $a $a $a $a $a Time Value of Money. Future Value of Lump Sum Rate Years $0.00 ACCOUNTING & FINANCIAL RATIOS CURRENT RATIO (Current Assets / Current Liabilities) TOTAL ASSET TURNOVER RATIO (Total Revenue / Total Assets) Current Assets Total Revenue Current Liabilities #DIV/0! Total Assets #DIV/01 WORKING CAPITAL (Current Assets - Current Liabilities) FINANCIAL LEVERAGE (Total Assets / Shareholder's Equity) Current Assets Total Assets Shareholder's Equity Current Liabilities #DIV/0! DEBT RATIO (Total Debt/Total Assets) NET PROFIT MARGIN (Net Income /Total Revenue) Total Debt Net Income Total Assets #DIV/0! Total Revenue #DIV/0! EARNINGS PER SHARE (Net Income / Weighted Average Common Shares Outstanding, RETURN ON ASSETS (Net Income / Total Assets) Net Income Net Income Total Assets Shares Outstanding #DIV/0! #DIV/01 PRICE EARNINGS RATIO (Share Price (end of quarter/EPS) RETURN ON EQUITY (Net Income - Preferred Dividends/Shareholder's Equity) Stock Price NI - Pref. Div. Shareholder's Equity EPS #DIV/0! #DIV/0! *Note to students: Be mindful of the scale being used in Mergent Online when filling this out. If a number is written as 12.53, that does not mean the total for that item is $12.53. There could be numerous zeros written after it, depending on the scale labeled above. In this example, 12.53 is actually $12,530,000. (To delete this comment, right-click on the "WORKING CAPITAL" box, then select Delete Comment from the drop-down menu.) Net Present Value (NPV) Calculator Building 1 3 4 5 6 7 9 10 S11 30 2 Sa 12 $n Initial Investment Annual Cash Intlows Discount Rate Number of Years Salvage Value Sa Year Conhows Year Cash Flows So 11 NPV- $0 13 14 15 16 17 SO 18 $0 19 20 501 SO $o $0 50 $ $0 so SO so Equipment Initial Investment Year 1 3 4 5 6 7 9 Cashflows $9 50 $0 $a Annual Cash Inflows Discount Rate $0 16 10 SC 20 NPV- $0 Year 11 12 13 15 17 18 19 14 sor Number of Years Cash Flows $0 SO sal SO SO Salvage Value Bonds Initial Investment Arr Cashindows Discount Rate Number of Years Princ Return NPV: Year 1 2 3 4 5 61 7 8 9 10 Cash Flows sol SD $0 $0 $0 $0 so sol $0 50 As Reported Quarterly Retained Earnings Report Date 04/03/2021 011 06/ 03/28/2020 2nd Quarter 1st 3rd 2nd Quarter USD US US USD Currency Audit Status Unaudited Un Un Unaudited Consolidated Yes Ye Yes Yes 38456000000 ### 43202000000 9000000 Previous retained earnings Dividends Reclassification of certain tax effects from accumulated other comprehensiv Intra-entity transfers of assets other than inventory Revenues from contracts with customers - -5000000 ### Adoption of new lease accounting guidance Retirement of treasury stock Distributions & other 13000000 WE ATTIT 68000000 Retained earnings 39365000000 ### 43721000000 As Reported Quarterly Cash Flow Report Date 04/03/2021 01/ 06/ 03/28/2020 2nd Quarter 1st 3rd 2nd Quarter USD US US USD Currency Audit Status Unaudited Un Un Unaudited Consolidated Yes Ye Yes Yes 1152000000 2708000000 2631000000 2570000000 HHH ### -481000000 ### #t ### Net income (loss) Net income (loss) from continuing operations Depreciation & amortization Net gain/(loss) on investments Goodwill & intangible asset impairment Net loss (gain) on acquisitions & investments Loss (gain) on acquisition Deferred income taxes Equity in the loss (income) of investees Cash distributions received from equity investees Net change in produced & licensed content costs & advances Net change in operating lease right of use assets / liabilities Equity-based compensation Other net income adjustments Receivables ### #*** -556000000 -437000000 372000000 - 1685000000 146000000 297000000 -359000000 405000000 ### -925000000 ### ### -96000000 270000000 246000000 490000000 ### ### 156000000 -37000000 ### 828000000 175000000 ### 70000000 -174000000 -131000000 ### if it -780000000 ### ### 400000000 ### -888000000 - 112000000 4787000000 1468000000 ### ### ### -1530000000 ### -2585000000 Inventories Other assets Accounts payable & other accrued liabilities Accounts payable & other liabilities Income taxes Net cash flows from operations - continuing operations Net cash flows from operating activities Investments in parks, resorts & other property Acquisitions Other investing activities Net cash flows from (used in) investing activities - continuing operations Net cash flows from investing activities Commercial paper borrowings/(payments), net Borrowings Reduction of borrowings Dividends Proceeds from exercise of stock options Acquisition of noncontrolling & redeemable noncontrolling interests Contributions from or sales of noncontrolling interests 203000000 ### -21000000 -2606000000 -1327000000 ### -87000000 ### ### 3138000000 37000000 ### ### 6071000000 -1816000000 ### ### -1048000000 - 1587000000 207000000 394000000 As Reported Quarterly Retained Earnings Report Date 04/03/2021 01/ 06/ 03/28/2020 1st 3rd 2nd Quarter 2nd Quarter USD US US USD Unaudited Un Un Unaudited Yes Yes Ye Yes 38456000000 ### #** 43202000000 9000000 Currency Audit Status Consolidated Previous retained earnings Dividends Reclassification of certain tax effects from accumulated other comprehensiv Intra-entity transfers of assets other than inventory Revenues from contracts with customers Adoption of new lease accounting guidance Retirement of treasury stock Distributions & other Retained earnings -5000000 HE HT HH THE 68000000 13000000 39365000000 ### ### 43721000000 As Reported Quarterly Cash Flow Report Date 01/ 06/ 03/28/2020 04/03/2021 2nd Quarter USD 1st 3rd 2nd Quarter US US USD Currency Audit Status Unaudited Un Un Unaudited Consolidated Yes Ye Yes Yes ALLAH MHR 1152000000 2570000000 -481000000 2708000000 2631000000 ### ### ### HH HA #*** -556000000 HE HAT TH HAT -437000000 HU HI ri 297000000 -359000000 405000000 -925000000 372000000 ### APP HT ### ### ### -96000000 ### ### ### 246000000 -1685000000 0.000000 146000000 270000000 490000000 -37000000 175000000 -131000000 ### HH 156000000 # ### 828000000 ### ### 70000000 ### HT - 174000000 -780000000 ### 400000000 ### HI -888000000 - 112000000 4787000000 ### 1468000000 ### ### Net income (loss) Net income (loss) from continuing operations Depreciation & amortization Net gain (loss) on investments Goodwill & intangible asset impairment Net loss (gain) on acquisitions & investments Loss (gain) on acquisition Deferred income taxes Equity in the loss (income) of investees Cash distributions received from equity investees Net change in produced & licensed content costs & advances Net change in operating lease right of use assets / liabilities Equity-based compensation Other net income adjustments Boccus Receivables Invento Inventories Oth Other assets Accounts payable & other accrued liabilities Accounts payable & other liabilities Income taxes Net cash flows from operations - continuing operations Net cash flows from operating activities Investments in parks, resorts & other property Acquisitions Other investing activities Net cash flows from (used in) investing activities - continuing operations Net cash flows from investing activities Commercial paper borrowings/payments), net Borrowings Reduction of borrowings Dividends Proceeds from exercise of stock options Acquisition of noncontrolling & redeemable noncontrolling interests Contributions from or sales of noncontrolling interests Net cash flows from financing activities - continuing operations Net cash flows from financing activities Cash flows from operating activities of discontinued operations Cash flows from financing activities of discontinued operations Cash flows from investing activities of discontinued operations Cash from (used in) operations - discontinued operations Impact of exchange rate on cash, cash equivalents & restricted cash Change in cash, cash equivalents & restricted cash Cash, cash equivalents & restricted cash, beginning of period Cash, cash equivalents & restricted cash, end of period - 1530000000 ### #*** -2585000000 203000000 ### TH AT IT -21000000 -2606000000 -1327000000 ### #*** ### ## w #* ### -87000000 37000000 -1816000000 3138000000 6071000000 ### HAH -1048000000 THE - 1587000000 394000000 #*** 207000000 6616000000 -2241000000 4000000 4000000 ### 198000000 4000000 8000000 ### ### 202000000 70000000 -76000000 ### ### ### ### -2022000000 8923000000 17954000000 ### ### 5455000000 14378000000 15932000000 ### ###
Step by Step Solution
There are 3 Steps involved in it

Get step-by-step solutions from verified subject matter experts