

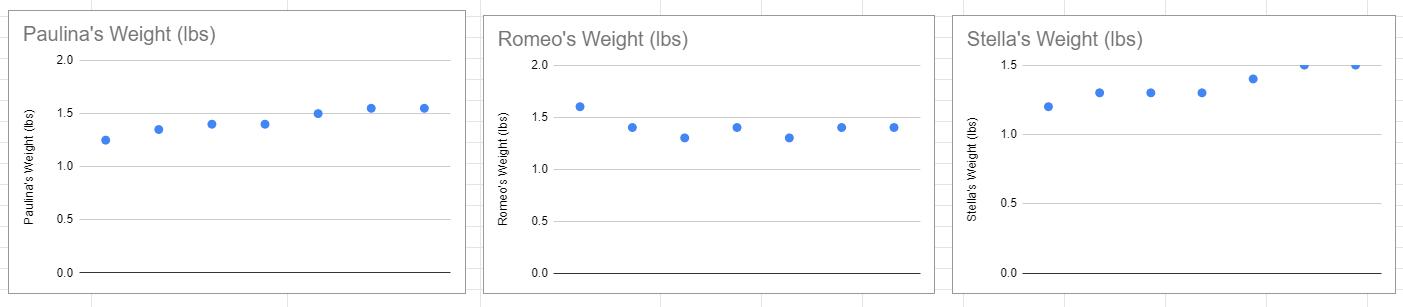
Question: Using these three graphs of kitten weights, for the two kittens whose weight data look roughly linear add their trendlines to their scatterplots. Also make
Using these three graphs of kitten weights, for the two kittens whose weight data look roughly linear add their trendlines to their scatterplots. Also make sure you can see the equations of these trendlines.
Then select one of the two trendline equations you just made and give its slope (also tell me which kitten you’re looking at!). What does that slope mean? Be sure to give the full unit on that number (remember, it’s a “per”). What does the y-intercept represent in these equations?
One of the kittens definitely doesn't have linear-looking weight changes. Give some reasons as to why that might be. Add the trendlines (with their equations) to the same two kittens’ graphs that you did in the previous questions. How do the slopes of the 14-day weights compare to the 7-day weights? What does that mean about how those two kittens were adding weight during the first week compared to the second week?
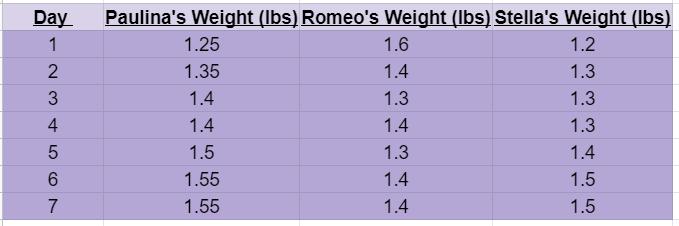
Day Paulina's Weight (Ibs) Romeo's Weight (Ibs) Stella's Weight (Ibs) 1 1.25 1.6 1.2 1.35 1.4 1.3 1.4 1.3 1.3 4 1.4 1.4 1.3 1.5 1.3 1.4 6. 1.55 1.4 1.5 7 1.55 1.4 1.5 2.
Step by Step Solution
3.37 Rating (156 Votes )
There are 3 Steps involved in it
solution For the kittens paulinas and Stellas weight dat... View full answer

Get step-by-step solutions from verified subject matter experts