Question: Using this information am I correct? Use the Excel OM Aggregate Planning spreadsheet and the data to prepare your aggregate plan. Produce a graph of
Using this information am I correct?
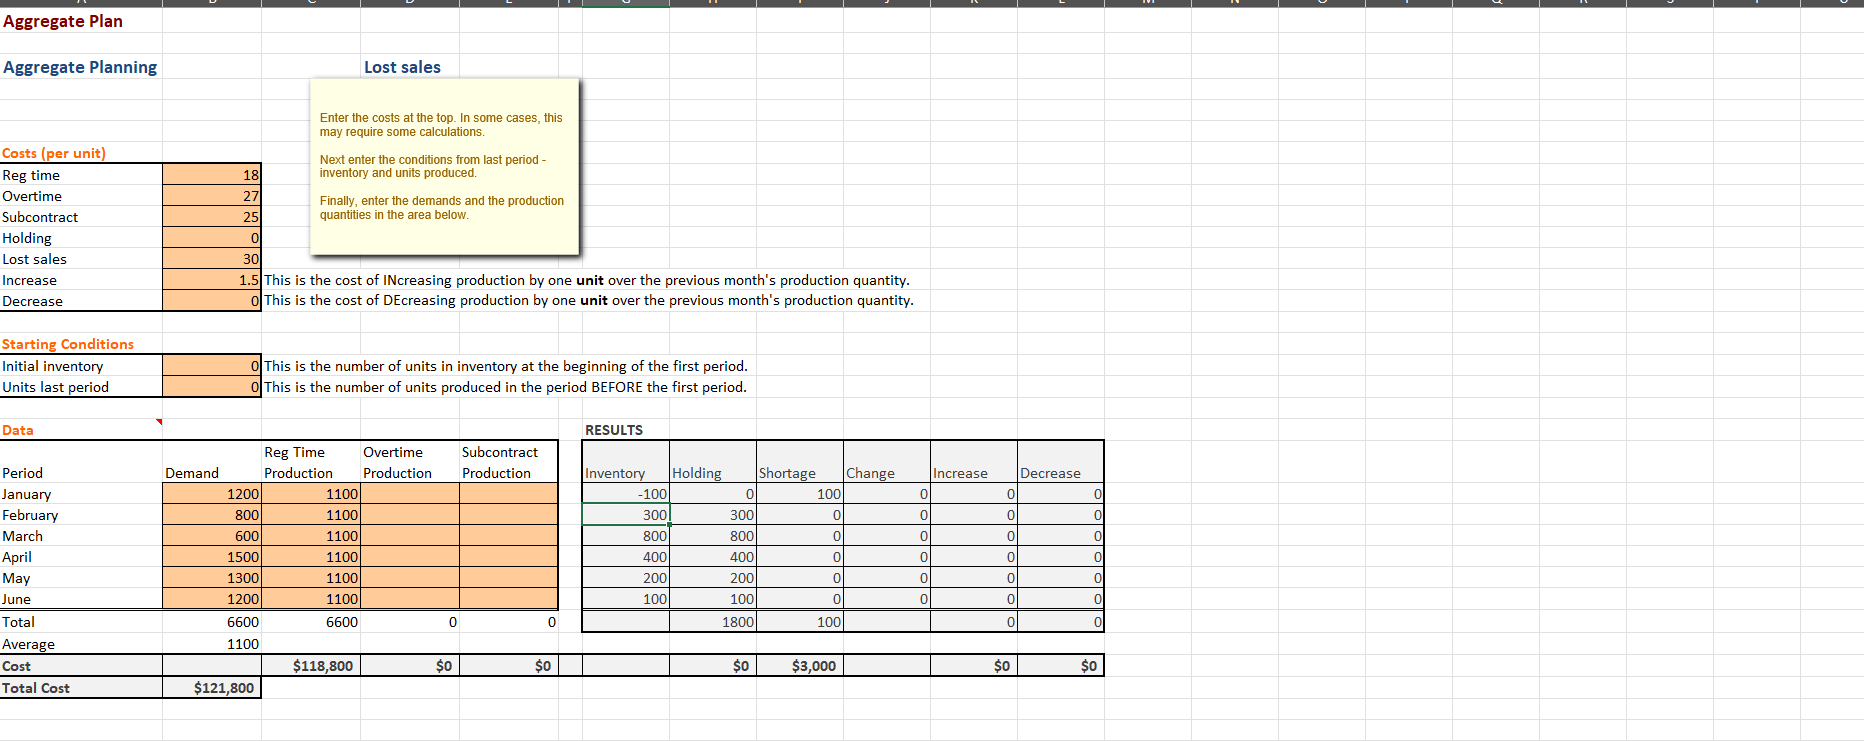
Use the Excel OM Aggregate Planning spreadsheet and the data to prepare your aggregate plan. Produce a graph of your plan. The intent is to use a level strategy (or level scheduling) with no overtime, no safety stock, and no subcontractors.
Hint 1 - Consider that it takes 1.5 hours to produce a unit when determining your cost per unit for average and overtime pay.
Hint 2 - To determine regular time production, you need to multiply the units per day produced by the number of production days.
Continue to Step 2: Update Your Aggregate Plan Using Overtime
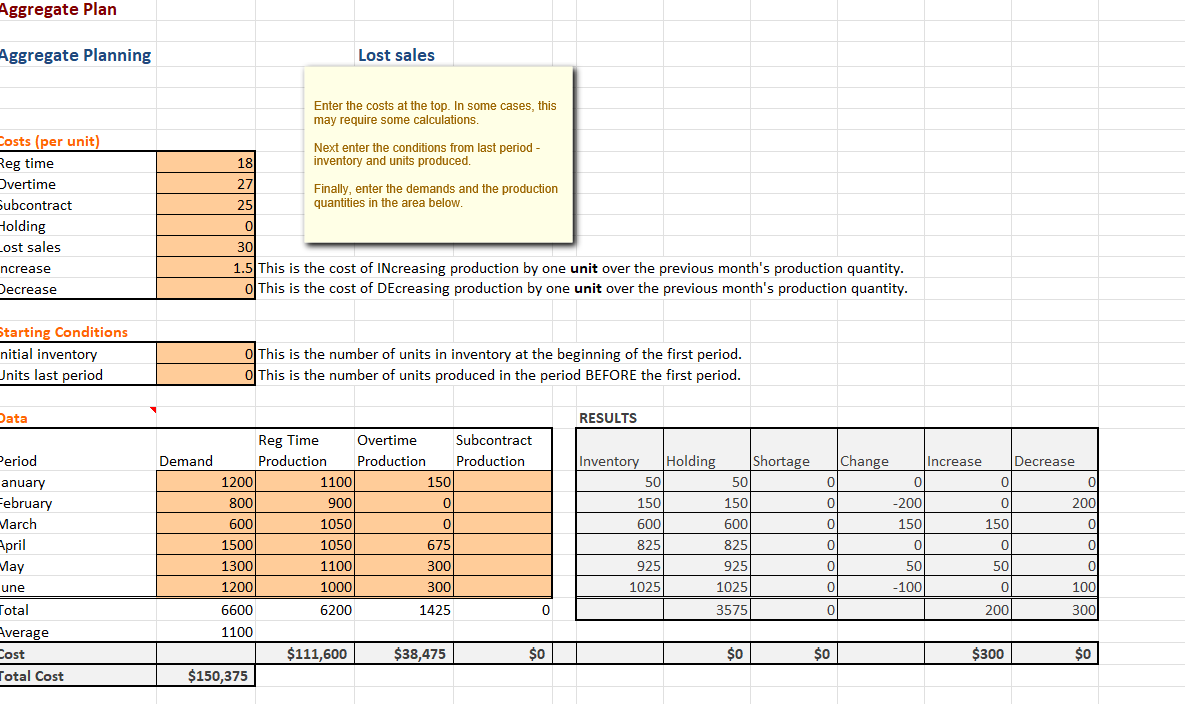
In the plan produced in Step 1, the production rate did not meet the total demand. If you were able to use overtime to meet the shortfall, what would your aggregate plan look like?
Use the Excel OM Aggregate Planning spreadsheet and the data to prepare an updated aggregate plan.
Continue to Step 3: Update Your Aggregate Plan Using Outsourcing
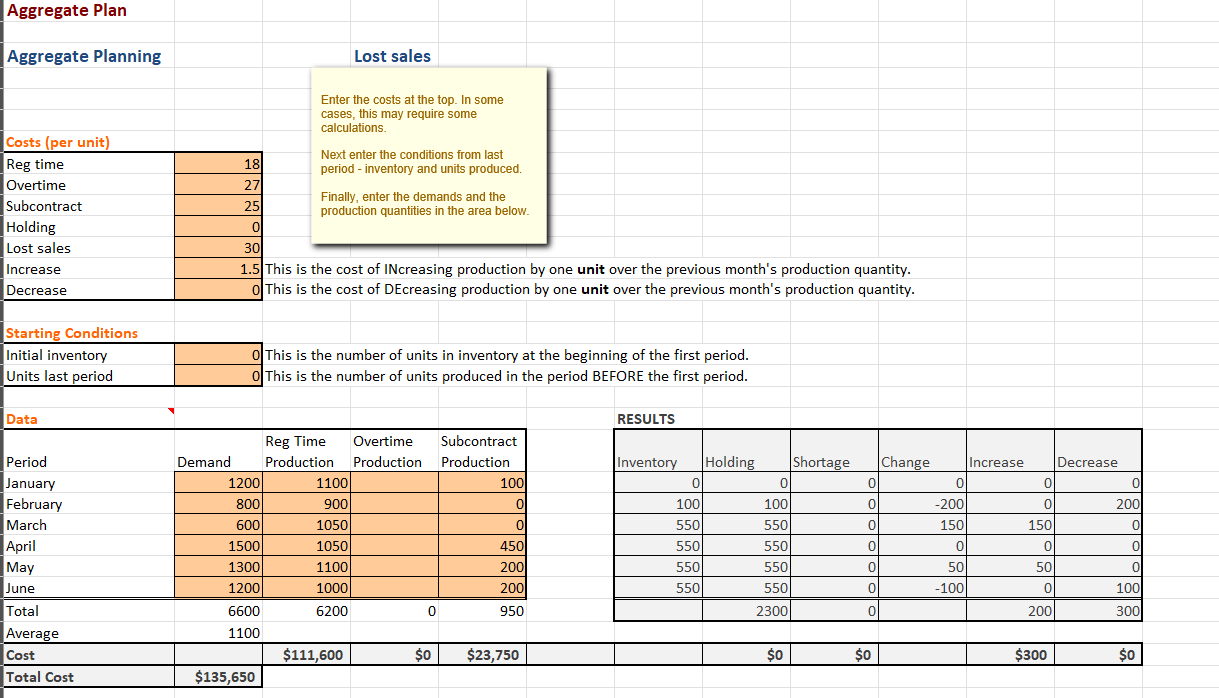
Instead of paying overtime, you might be able to outsource the shortfall in production. Use the Excel OM Aggregate Planning spreadsheet and the data to prepare an updated aggregate plan using outsources instead of paying overtime.
Continue to Step 4: Summarize and Submit
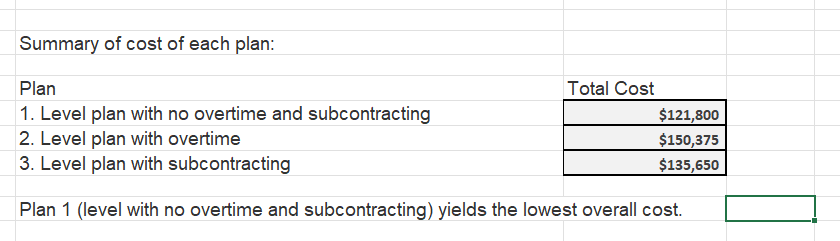
On a fourth tab of the spreadsheet, summarize your cost and determine which of the three options produces the lowest overall cost. Be sure to provide a detailed analysis along with your summary data.
Submit one spreadsheet containing a tab for each step. Save your assignment using a naming convention that includes your first and last name and the activity number (or description). Do not add punctuation or special characters.
Review the Problems Rubric for detailed grading information.
Aggregate Plan Aggregate Planning Lost sales Enter the costs at the top. In some cases, this may require some calculations Costs (per unit) Next enter the conditions from last period - Reg time 78] inventory and units produced Overtime 27 Finally, enter the demands and the production Subcontract 25 quantities in the area below Holding o Lost sales 30| Increase 1.5] This is the cost of INcreasing production by one unit over the previous month's production quantity. Decrease O|This is the cost of DEcreasing production by one unit over the previous month's production quantity. Starting Conditions Initial inventory S This is the number of units in inventory at the beginning of the first period. Units last period O|This is the number of units produced in the period BEFORE the first period. Data 1 RESULTS Reg Time Overtime Subcontract Period Demand Production Production _ Production Inventory _|Holding Shortage _|Change Increase |Decrease January 1200] 1100) -100| 100| February 800] 1100) 300] March 600] 1100) i April 1500) 1100) May 1300) 1100 June 1200) 1100) Total 6600 6600 0 0 Average 1100 Cost $118,800 $o $o $o $3,000 $o $o ] Total Cost $121,800 Aggregate Plan Aggregate Planning Lost sales Enter the costs at the top. In some cases, this may require some calculations. Costs (per unit) Next enter the conditions from last Reg time 18 period - inventory and units produced. Overtime 27 Finally, enter the demands and the Subcontract 25 production quantities in the area below. Holding 0 Lost sales 30 Increase 1.5 This is the cost of INcreasing production by one unit over the previous month's production quantity. Decrease O This is the cost of DEcreasing production by one unit over the previous month's production quantity. Starting Conditions Initial inventory This is the number of units in inventory at the beginning of the first period. Units last period O This is the number of units produced in the period BEFORE the first period. Data RESULTS Reg Time Overtime Subcontract Period Demand Production Production Production Inventory Holding Shortage Change Increase Decrease January 1200 1100 100 0 0 0 0 0 February 800 900 O 100 0 -200 0 200 March 600 1050 0 550 550 150 150 0 April 1500 1050 150 550 550 0 May 1300 1100 200 550 550 50 50 June 1200 1000 200 550 550 O -100 0 100 Total 6600 6200 0 950 2300 O 200 300 Average 1100 Cost $111,600 $23,750 $0 $0 $300 Total Cost $135,650Summary of cost of each plan: Plan Total Cost 1. Level plan with no overtime and subcontracting 2. Level plan with overtime 3. Level plan with subcontracting Plan 1 (level with no overtime and subcontracting) yields the lowest overall cost. | Aggregate Plan Aggregate Planning Lost sales Enter the costs at the top. In some cases, this may require some calculations. Costs (per unit) Next enter the conditions from last period - leg time 18 inventory and units produced. Overtime 27 Finally, enter the demands and the production subcontract 25 quantities in the area below. Holding 0 ost sales 30 ncrease 1.5 This is the cost of INcreasing production by one unit over the previous month's production quantity. Decrease O This is the cost of DEcreasing production by one unit over the previous month's production quantity. tarting Conditions nitial inventory O This is the number of units in inventory at the beginning of the first period. Units last period This is the number of units produced in the period BEFORE the first period. Data RESULTS Reg Time Overtime Subcontract Period Demand Production Production Production Inventory Holding Shortage Change Increase Decrease anuary 1200 1100 150 50 50 0 February 800 900 0 150 150 0 -200 0 200 March 600 1050 0 500 600 O 150 150 April 1500 1050 675 825 325 0 0 0 May 1300 1100 300 925 925 0 50 50 une 1200 1000 300 1025 1025 0 -100 0 100 otal 6600 6200 1425 0 3575 0 200 300 Average 1100 Cost $111,600 $38,475 $o $0 $0 $300 SO Total Cost $150,375
Step by Step Solution
There are 3 Steps involved in it
1 Expert Approved Answer
Step: 1 Unlock
Question Has Been Solved by an Expert!
Get step-by-step solutions from verified subject matter experts
Step: 2 Unlock
Step: 3 Unlock
Students Have Also Explored These Related General Management Questions!