

Question: This chart provides the variables and cost for each variable. V a r i a b l e s C o s t I n
This chart provides the variables and cost for each variable.
This chart provides the demand for the product and the number of production days per month.
tableMonthsDemand,Production DaysJanuaryFebruaryMarchAprilMayJune
Complete the steps in each section and then submit your assignment for grading. Submit one spreadsheet containing a tab for each step.
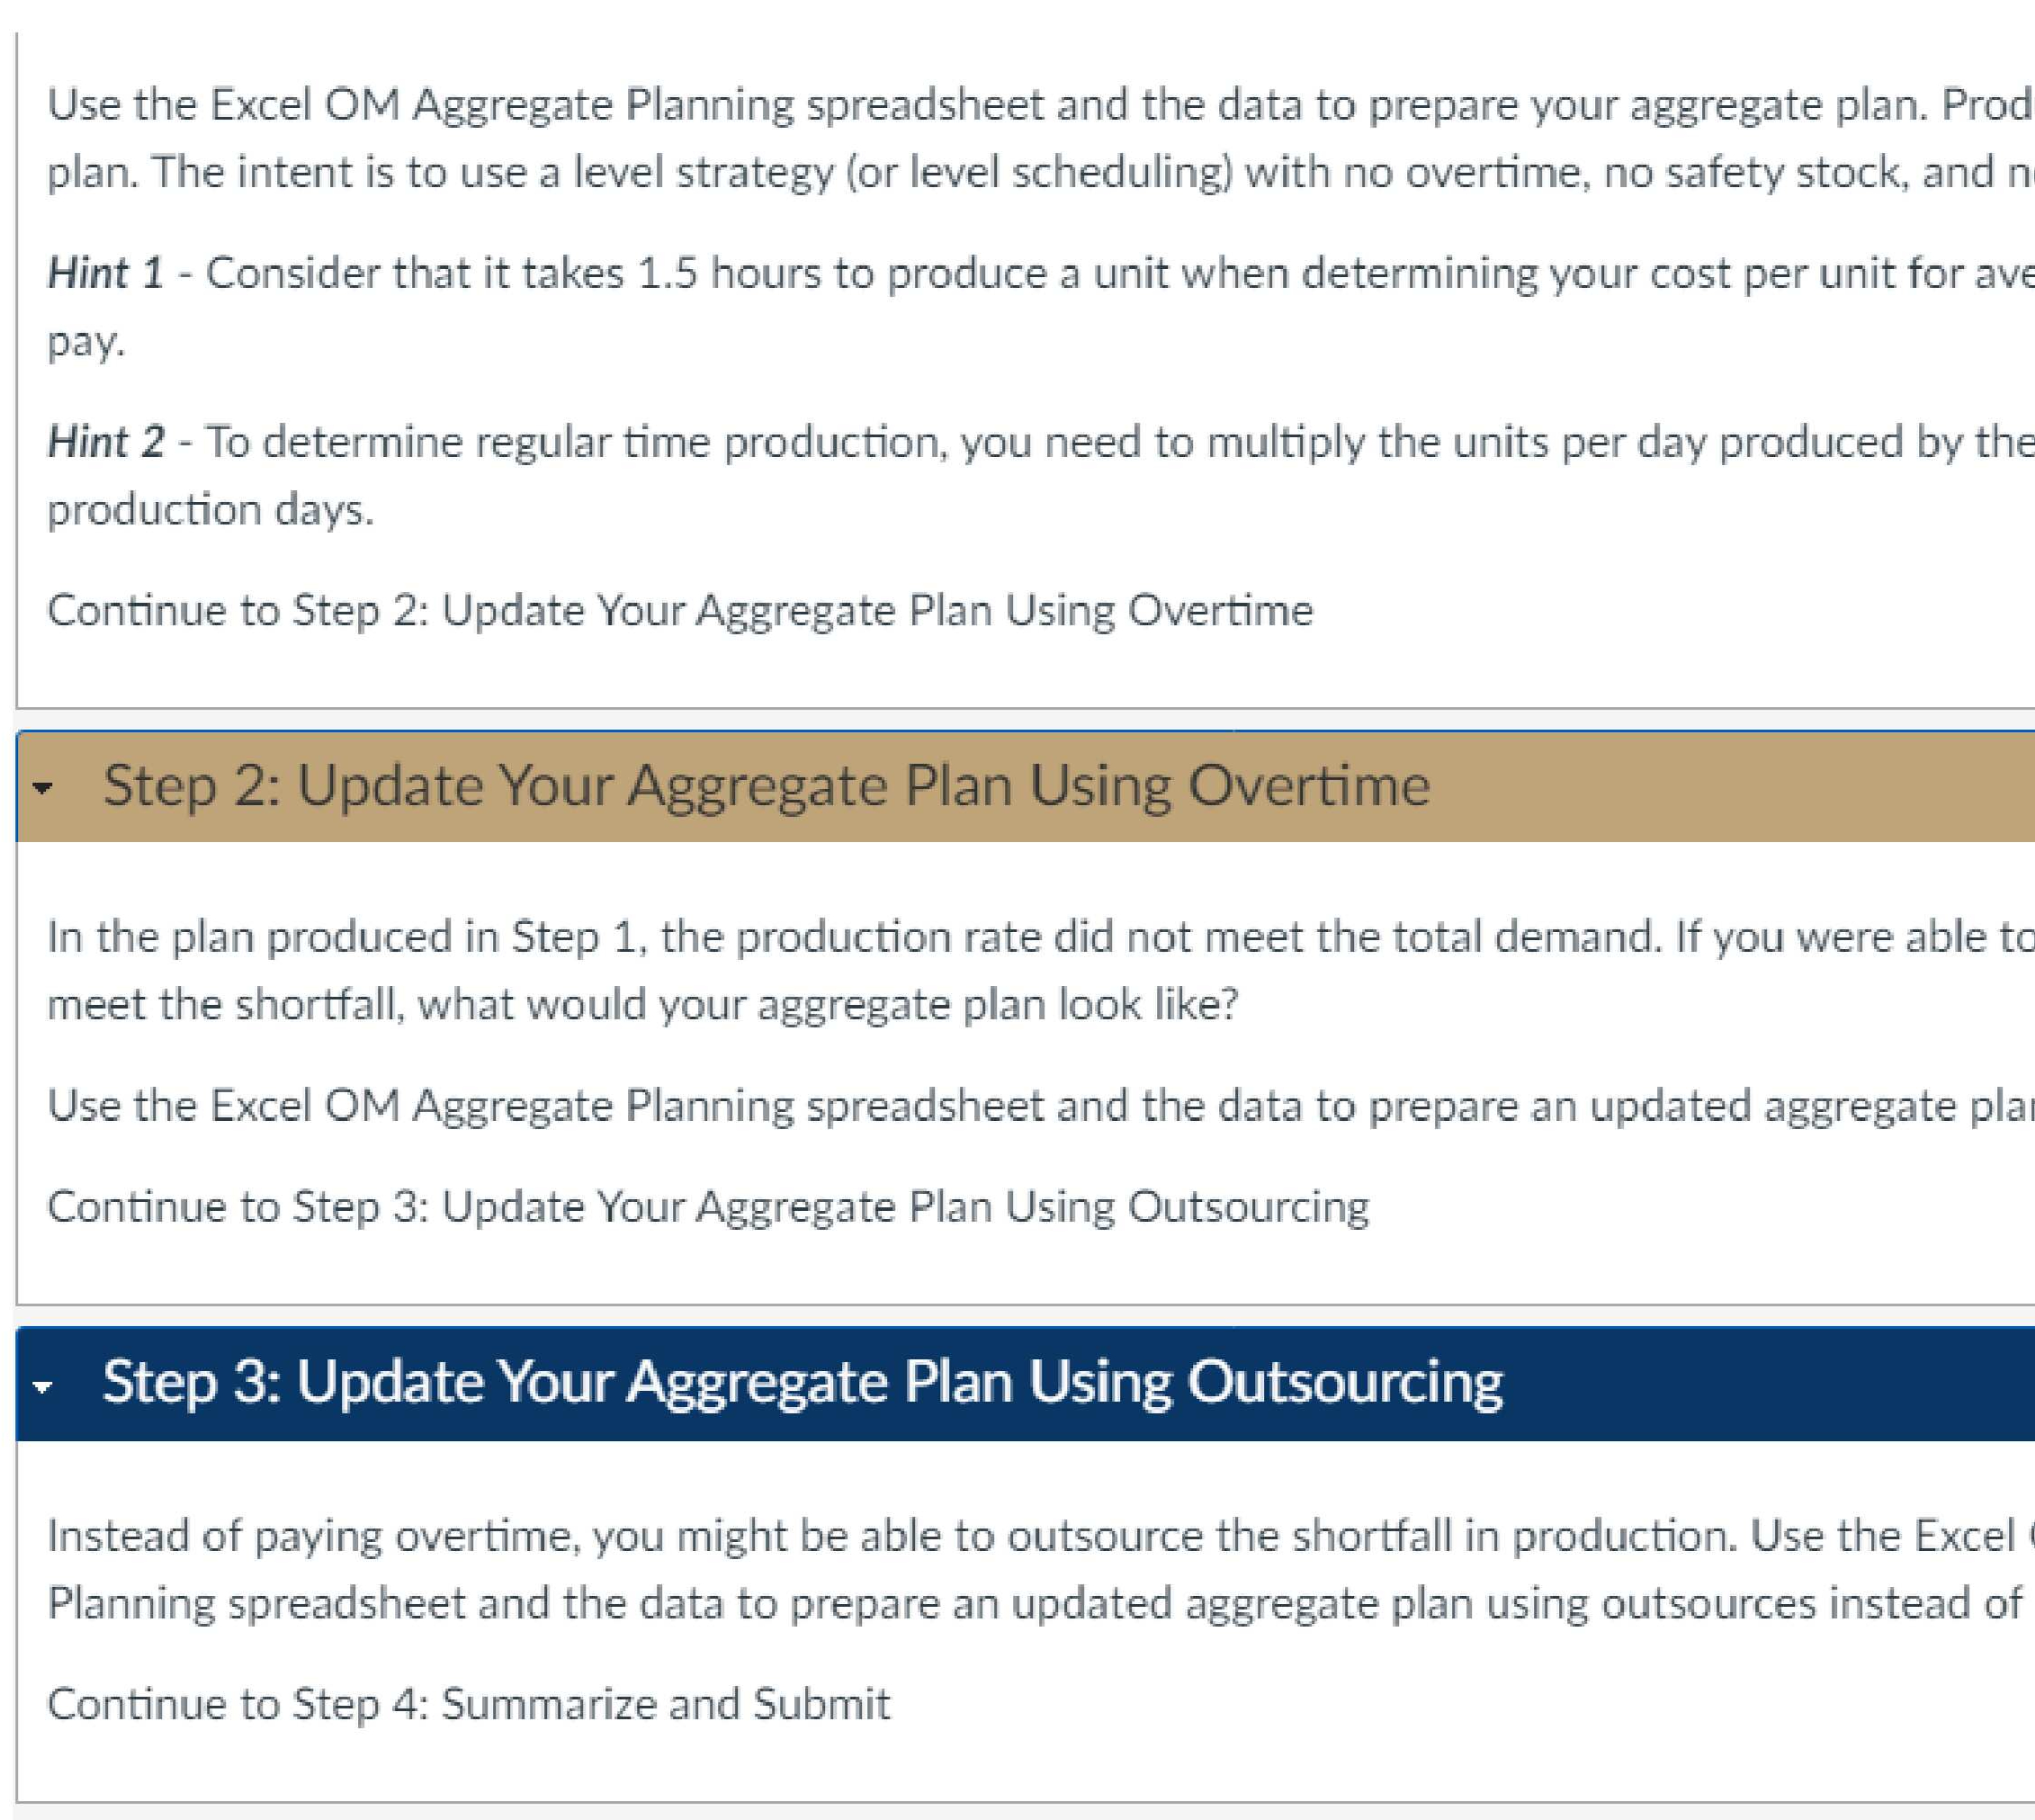
Use the Excel OM Aggregate Planning spreadsheet and the data to prepare your aggregate plan. Prod
plan. The intent is to use a level strategy or level scheduling with no overtime, no safety stock, and n
Hint Consider that it takes hours to produce a unit when determining your cost per unit for ave
pay.
Hint To determine regular time production, you need to multiply the units per day produced by the
production days.
Continue to Step : Update Your Aggregate Plan Using Overtime
Step : Update Your Aggregate Plan Using Overtime
In the plan produced in Step the production rate did not meet the total demand. If you were able to
meet the shortfall, what would your aggregate plan look like?
Use the Excel OM Aggregate Planning spreadsheet and the data to prepare an updated aggregate pla
Continue to Step : Update Your Aggregate Plan Using Outsourcing
Step : Update Your Aggregate Plan Using Outsourcing
Instead of paying overtime, you might be able to outsource the shortfall in production. Use the Excel
Planning spreadsheet and the data to prepare an updated aggregate plan using outsources instead of
Step by Step Solution
There are 3 Steps involved in it
1 Expert Approved Answer
Step: 1 Unlock

Question Has Been Solved by an Expert!
Get step-by-step solutions from verified subject matter experts
Step: 2 Unlock
Step: 3 Unlock