

Question: Using this previous weekly demand, calculate and answer the following forecasts for each period possible. Anwer with Excel Formula Question 1.A product has a consistent
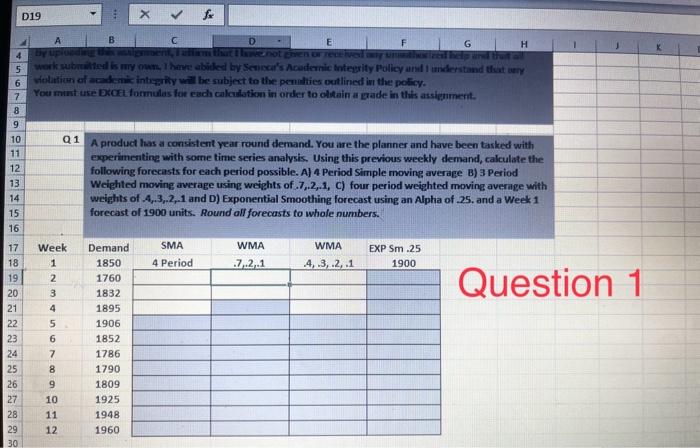
Using this previous weekly demand, calculate and answer the following forecasts for each period possible.
Anwer with Excel Formula
Question 1.A product has a consistent year round demand. You are the planner and have been tasked with experimenting with some time series analysis. A] 4 Period Simple moving average B) 3 Period Weighted moving average using weights of .7, 2,.1, C) four period weighted moving average with weights of 4,3, 2,-1 and D) Exponential Smoothing forecast using an Alpha of .25. and a Week 1 forecast of 1900 units. Round all forecasts to whole numbers.
Question 2. For each of the forecasts and demand below, calculate the Mean Absolute Deviation, Mean Squared Error and Mean Absolute Percent Error.
Use the ABS formula for Absolute Value. NOTE: Use formulas for each calculation.
Use one decimal place for each calculation
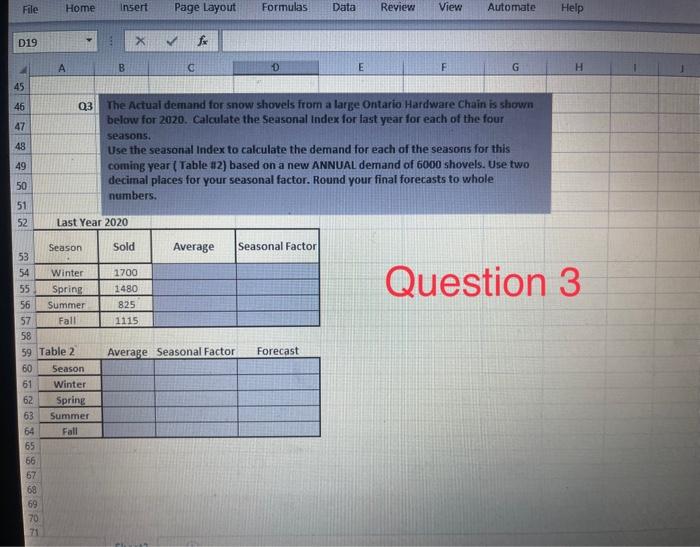
Question 3
The Actual demand for snow shovels from a large Ontario Hardware Chain is shown below for 2020. Calculate the Seasonal Index for last year for each of the four seasons.
Use the seasonal Index to calculate the demand for each of the seasons for this coming year ( Table #2) based on a new ANNUAL demand of 6000 shovels. Use two decimal places for your seasonal factor. Round your final forecasts to whole numbers.p
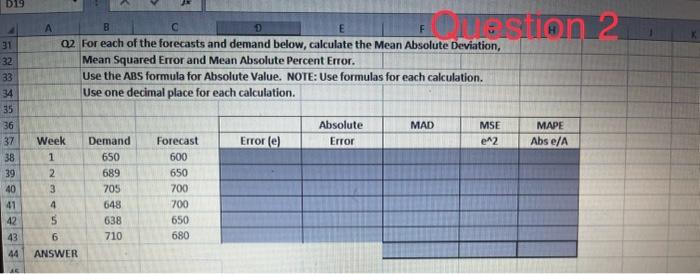
A Q2. For each of the forecasts and demand below, calculate the Mean Absolute Deviation, Mean Squared Error and Mean Absolute Percent Error. Use the ABS formula for Absolute Value. NOTE: Use formulas for each calculation. Use one decimal place for each calculation. \begin{tabular}{|c|c|c|} \hline Week & Demand & Forecast \\ \hline 1 & 650 & 600 \\ \hline 2 & 689 & 650 \\ \hline 3 & 705 & 700 \\ \hline 4 & 648 & 700 \\ \hline 5 & 638 & 650 \\ \hline 6 & 710 & 680 \\ \hline \end{tabular} \begin{tabular}{|c|c|c|c|c|} \hline & Absolute & MAD & MSE & MAPE \\ \hline Error (e) & Error & & e2 & Abs e/A \\ \hline & & & & \\ \hline & & & & \\ \hline & & & & \\ \hline & & & & \\ \hline & & & & \\ \hline \end{tabular} ANSWER A product has a convistent year round demand. You are the planner and have been tasked with experimenting with some time series analysis, Using this previous weekly demand, calculate the following forecasts for each period possible. A) 4 Period Simple moving average B) 3 Period Weighted moving awerage using weights of .7,2,1, C) four period weighted moving average with weights of 4,3,.2,.1 and D) Exponential Smoothing forecast using an Apha of 25 , and a Week 1 forecast of 1900 units. Round afl forecasts to whole numbers. The Actual demand for snow shovels from a large Oritarto Hafdware Chain is shown below for 2020. Calculate the seasonal index for last year for each of the four seasons. Use the seasonal Index to calculate the demand for each of the seasons for this coming year ( Table i2) based on a new ANNUAL demand of 6000 shovels. Use two decimal places for your seasonal factor. Round your final forecasts to whole numbers
Step by Step Solution
There are 3 Steps involved in it

Get step-by-step solutions from verified subject matter experts