

Question: Using VehicleFailureData, summarize the data for failures in top 10 (maximum number of vehicle failures) states by constructing the following: a) Relative and percent frequency
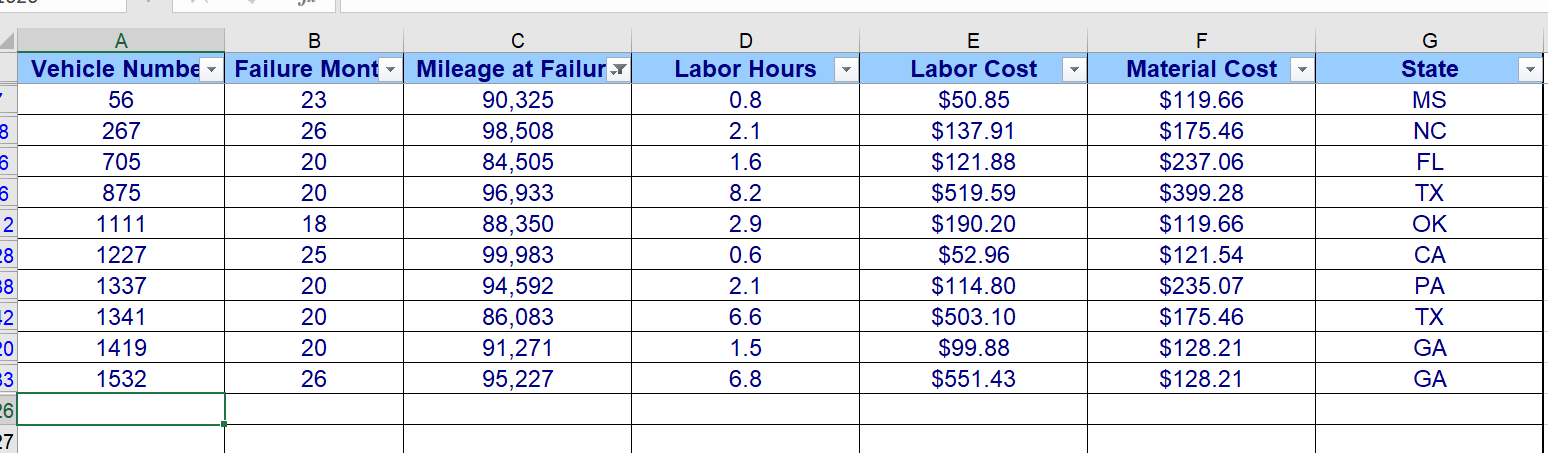
Using VehicleFailureData, summarize the data for failures in top 10 (maximum number
of vehicle failures) states by constructing the following:
a) Relative and percent frequency distributions
b) Bar chart
c) Pie chart
d) Find top three states with maximum number of vehicles failures.
Note: First insert a Pivot Table, then drag and drop State under Row and Value fields. Then
select Data Tab and arrange Total (second column, which represents the total number of
vehicle failures) in descending order (largest to smallest). Now select the top 10 states.
Step by Step Solution
There are 3 Steps involved in it
1 Expert Approved Answer
Step: 1 Unlock

Question Has Been Solved by an Expert!
Get step-by-step solutions from verified subject matter experts
Step: 2 Unlock
Step: 3 Unlock