

Question: Using your own data, plot the OLS residuals versus all variables in the model. Do you observe any patterns suggesting that heteroscedasticity is present? 9.
Using your own data, plot the OLS residuals versus all variables in the model. Do you observe any patterns suggesting that heteroscedasticity is present?
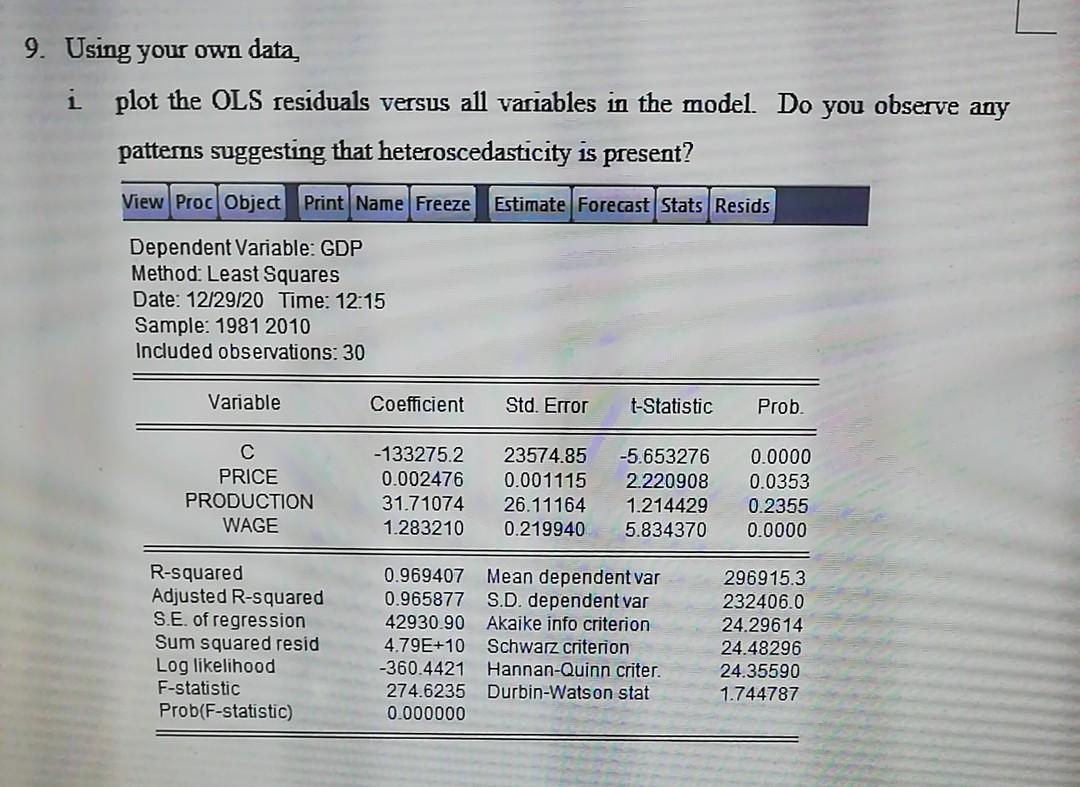
9. Using your own data i plot the OLS residuals versus all variables in the model. Do you patterns suggesting that heteroscedasticity is present? observe any View Proc Object Print Name Freeze Estimate Forecast Stats Resids Dependent Variable: GDP Method: Least Squares Date: 12/29/20 Time: 12:15 Sample: 1981 2010 Included observations: 30 Variable Coefficient Std. Error t-Statistic Prob. PRICE PRODUCTION WAGE -133275.2 0.002476 31.71074 1.283210 23574.85 0.001115 26.11164 0.219940 -5.653276 2.220908 1.214429 5.834370 0.0000 0.0353 0.2355 0.0000 R-squared Adjusted R-squared S.E. of regression Sum squared resid Log likelihood F-statistic Prob(F-statistic) 0.969407 Mean dependent var 0.965877 S.D. dependent var 42930.90 Akaike info criterion 4.79E+10 Schwarz criterion -360.4421 Hannan-Quinn criter. 274.6235 Durbin-Watson stat 0.000000 296915.3 232406.0 24.29614 24.48296 24.35590 1.744787
Step by Step Solution
There are 3 Steps involved in it

Get step-by-step solutions from verified subject matter experts