

Question: v Case Study 1 FROM BEAN TO CUP: STARBUCKS GLOBAL SUPPLY CHAIN CHALLENGE Starbucks Corporation is the largest coffeehouse company in the world with over
v 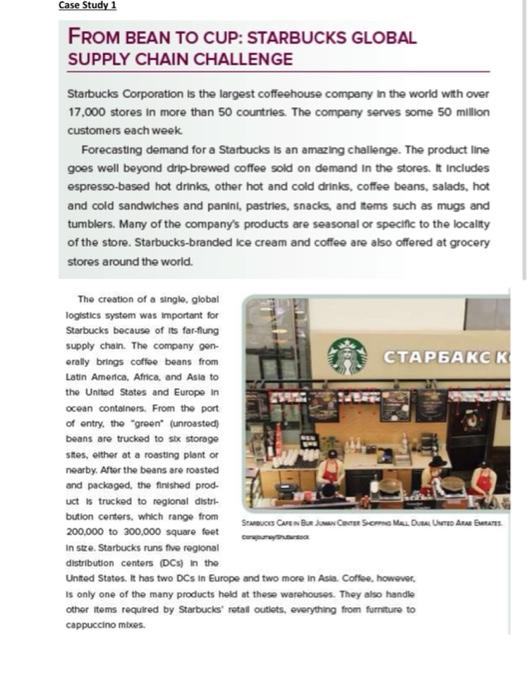
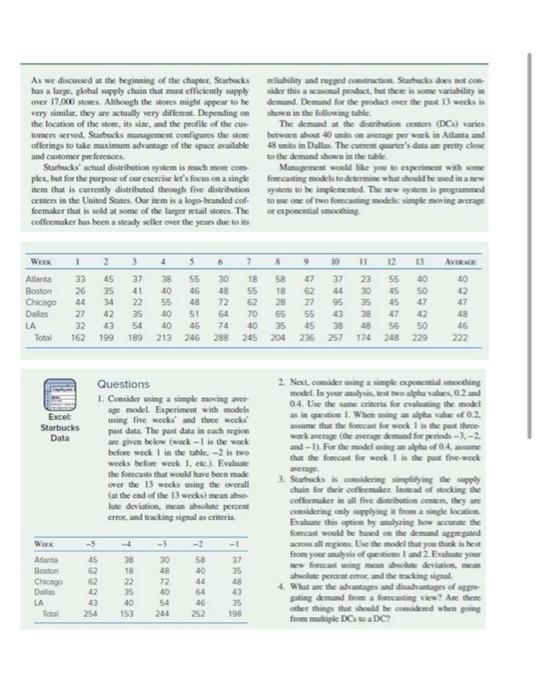
Case Study 1 FROM BEAN TO CUP: STARBUCKS GLOBAL SUPPLY CHAIN CHALLENGE Starbucks Corporation is the largest coffeehouse company in the world with over 17,000 stores in more than 50 countries. The company serves some 50 million customers each week Forecasting demand for a Starbucks is an amazing challenge. The product line goes well beyond drip brewed coffee sold on demand in the stores. It includes espresso-based hot drinks, other hot and cold drinks, coffee beans, salads, hot and cold sandwiches and panini, pastries, snacks, and tems such as mugs and tumblers. Many of the company's products are seasonal or specific to the locality of the store. Starbucks-branded ice cream and coffee are also offered at grocery stores around the world. The creation of a single global Togistics systom was important for Starbucks because of its far-flung supply chain. The company gen- orally brings coffee beans from Latin America, Africa, and Asia to the United States and Europe in ocean containers. From the port of entry, the "green" (unroasted) beans are trucked to sex storage stes, either at a roasting plant or nearby. After the beans are roasted and packaged, the finished prod. uct is trucked to regional distri bution centers, which range from 200,000 to 200.000 square feet Stuces Crew Burm. Carme Score Me Do Uhren Anak Suam In stze. Starbucks runs five regional distribution centers (DCs) in the Unted States. It has two DCs in Europe and two more in Asia Coffee, however, Is only one of the many products held at these warehouses. They also handle other items required by Starbucks' retail outlets, everything from furniture to cappuccinombres As we discussed at the beginning of the chapter. Starbucks reliability and rugged construction Startracks does not con has a large, global supply chain that must efficiently supply sider this areasonal product, but there is some variability in over 17,000 stores. Although the store might appear to be demand. Demand for the product over the past 13 weeksi very similar, they are actually very different. Depending on shown in the following table the location of the store, its size and the profile of the cu The demand at the distribution center (DC) varies tomer served. Startucks management configures the store between about units own per week in Atlanta and offerings to take maximum advantage of the space available 48 units in Dallas The current quarter's data pretty close and customer preferences to the demand shown in the table Starbucks' actual distribution system is much more com Management would like you experiment with some ples, but for the purpose of our exercicket's focus on a single forecasting models to determine what should be wed in a new item that is currently distributed through fre distribution system to be implemented. The new system is programmed centers in the United States Our item is a logo-branded code to use one of two forecasting model simple moving average feemaker that is sold at some of the larger retail stores. The or exponential imoothing coffeemaker has been a steady seller over the years due to its 1 2 4 5 6 7 9 11 33 AVERE WRX Atlanta Boston Chicago Dallas LA Total 33 26 44 27 32 162 37 44 95 3 37 41 22 35 54 189 45 35 34 42 43 199 38 55 40 55 48 40 51 40 46 213 246 30 48 72 64 74 288 18 55 62 70 30 245 58 18 28 65 35 204 47 62 27 55 45 236 9889 22 20 35 38 B 174 NRRS 55 45 50 45 47 42 56 50 248 229 40 42 47 48 46 222 8 257 Excel Starbucks Data Questions 1. Consider using a simple moving aver ape model Experiment with models wing the week and the week put data. The past data in cach region are given below (weck - is the weck before week 1 in the table - 2 is two weeks before weck 1. Evaluate the forecasts that would have been made over the 13 wecks using the overall at the end of the 13 weeks) menah lute deviation, mean boule peront error and tracking signal a criteria 2 Next considering a simple expect moothing model. In your site wo alpe vales, 0.2 and 04. Use theme criteria foting the model as in question 1. When using an alpha value of 0.2. assume that the forecast for wock 1 is the past three wak verage (the crage demand for periode 1-2 and-1). For the modeling an all of 04. that the forecast for wock 1 is the past the week Studs i cidering simplifying the supply chain for their coffeemaker. Instead of stocking the coffeemaker in all five ion centen, they are considering only applying it a single location Evaluate this option by myring how weate the forecast would be used the demand agregated across all region we the model that you think best from your analysis of land 2. Evaluate your w forecasting mente deviation, mean absolute peront round the tracking signal What are the head disadvantages of are gating demand from a forecasting view ? Are there ther things that should be comidered when ping from multiple X a DC Ws Aslanta Boston Chicago De LA Total - 45 62 62 42 43 254 28 18 22 35 40 153 30 48 72 40 54 204 58 40 4 66 46 252 -1 37 35 48 43 5 198
Step by Step Solution
There are 3 Steps involved in it
1 Expert Approved Answer
Step: 1 Unlock

Question Has Been Solved by an Expert!
Get step-by-step solutions from verified subject matter experts
Step: 2 Unlock
Step: 3 Unlock