

Question: V Jump to level 1 1 V The scatter plot shows the relationship between the mass of a tree and the total mass of the
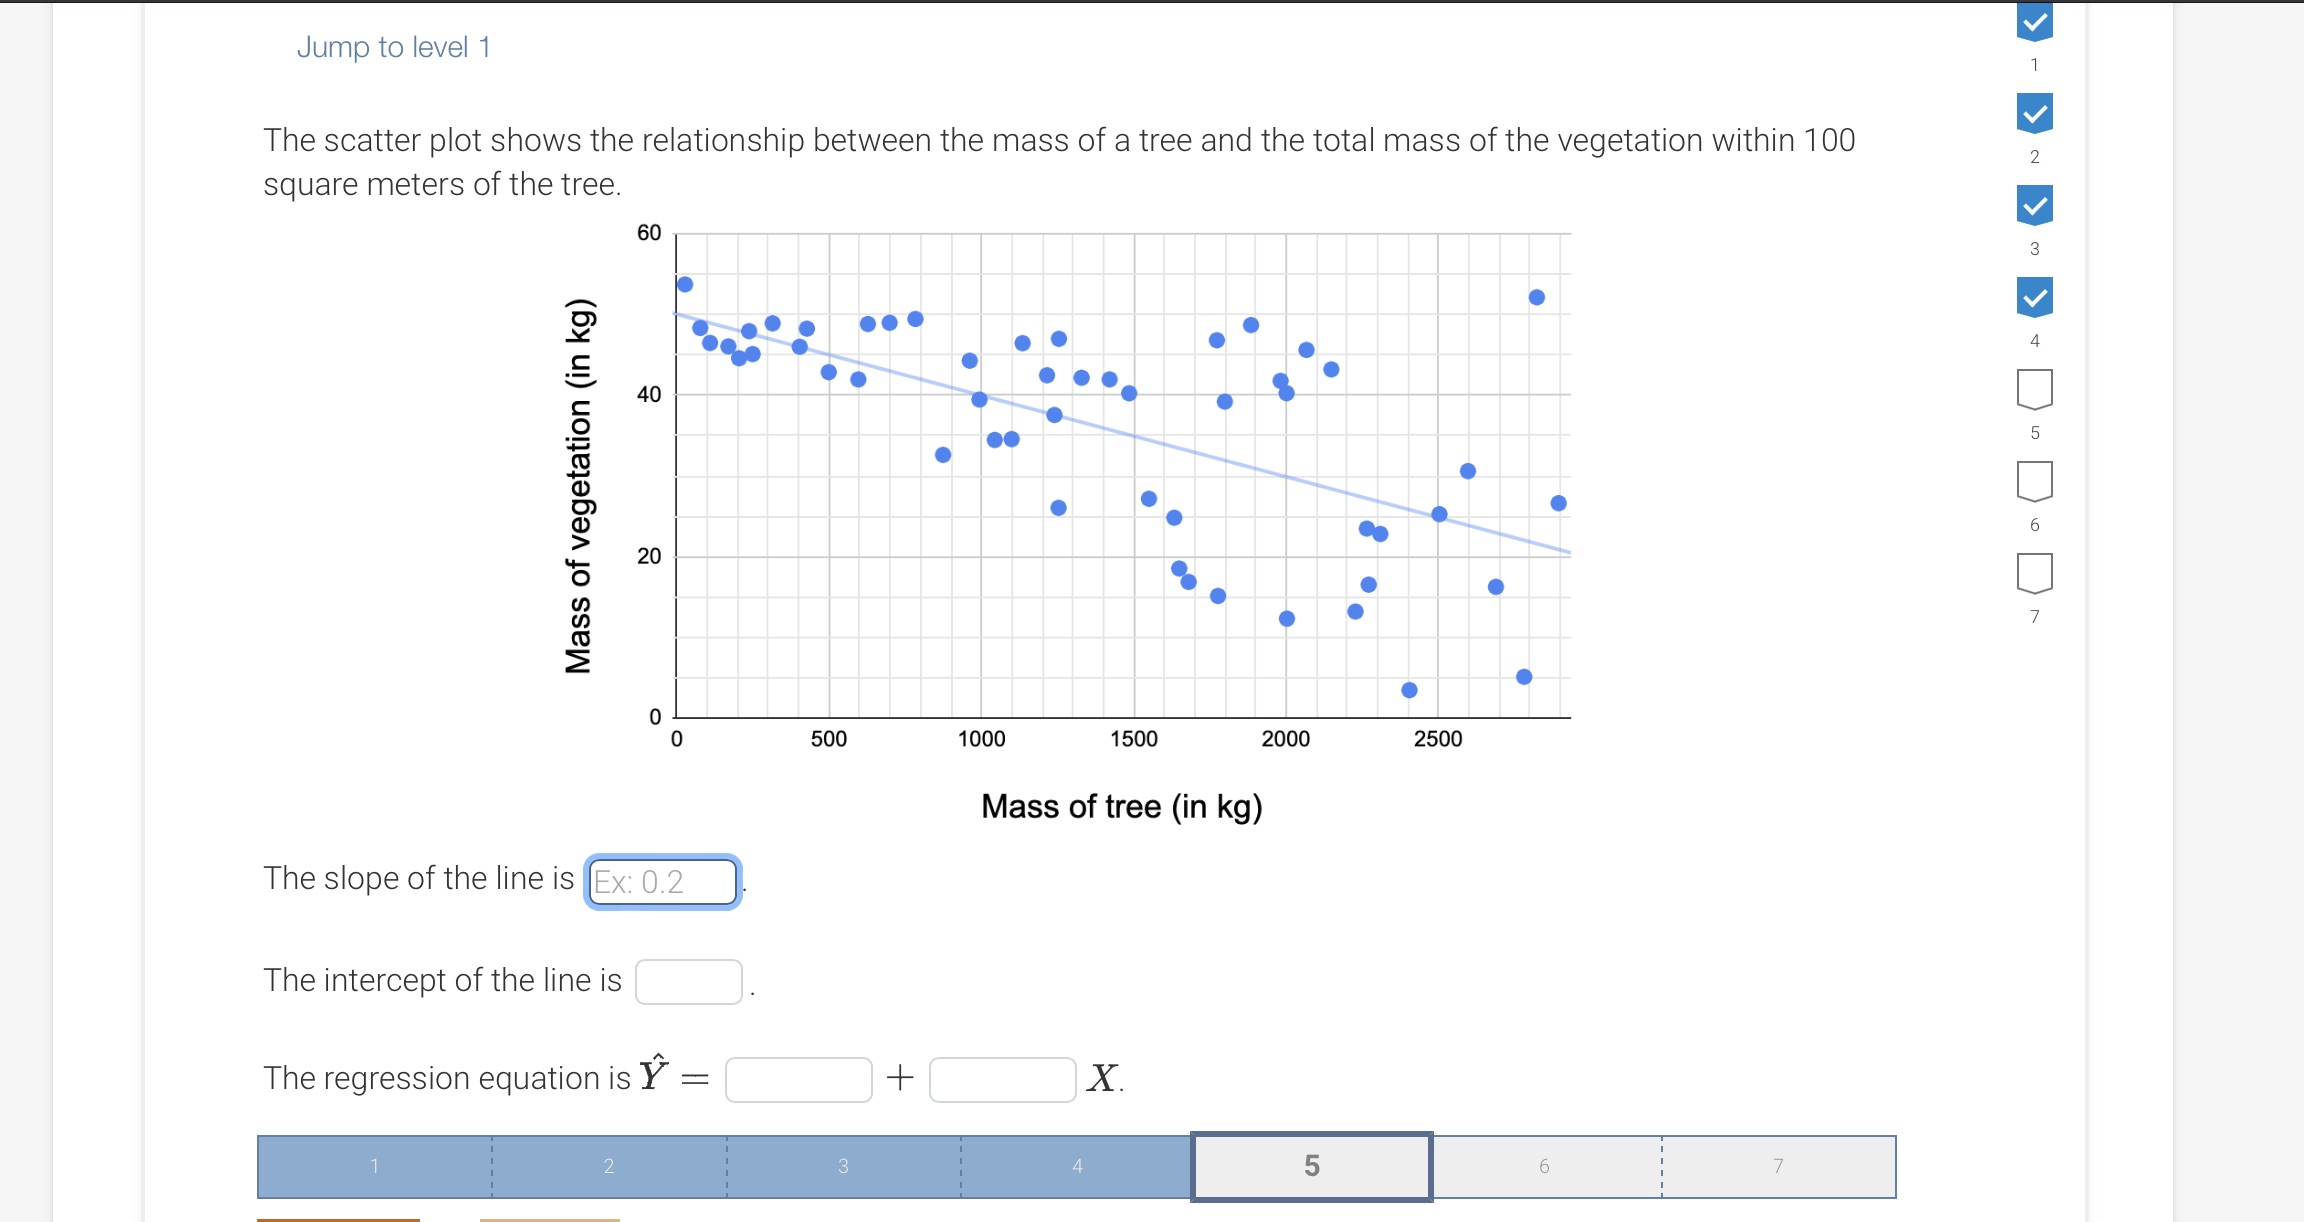
V Jump to level 1 1 V The scatter plot shows the relationship between the mass of a tree and the total mass of the vegetation within 100 2 square meters of the tree. V 60 3 v 40 Mass of vegetation (in kg) 20 0 0 500 1000 1500 2000 2500 Mass of tree (in kg) The slope of the line is Ex: 0.2 The intercept of the line is The regression equation is Y = + X. 2 3 4 5 6 7
Step by Step Solution
There are 3 Steps involved in it
1 Expert Approved Answer
Step: 1 Unlock

Question Has Been Solved by an Expert!
Get step-by-step solutions from verified subject matter experts
Step: 2 Unlock
Step: 3 Unlock