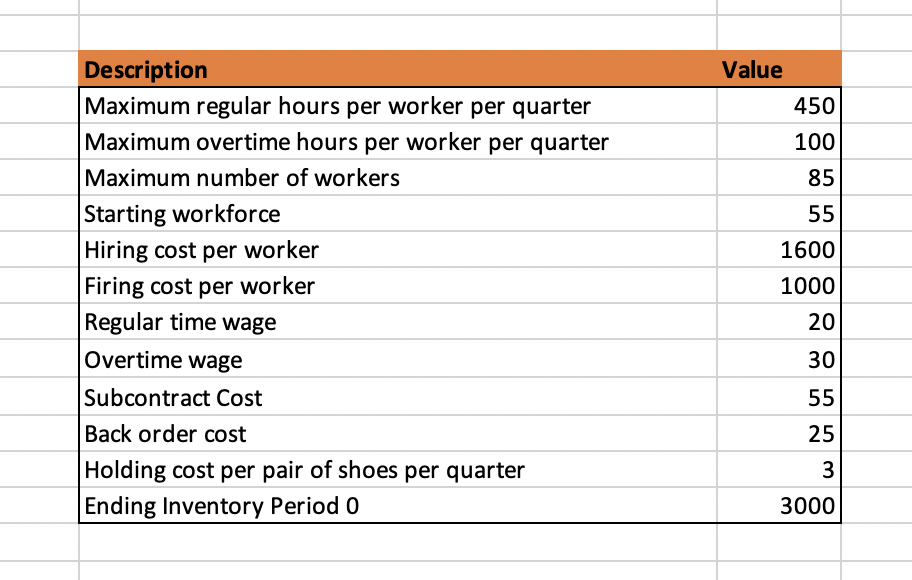
Question: Value 450 100 85 55 1600 Description Maximum regular hours per worker per quarter Maximum overtime hours per worker per quarter Maximum number of workers

Value 450 100 85 55 1600 Description MaximumValue 450 100 85 55 1600 Description MaximumValue 450 100 85 55 1600 Description Maximum

Value 450 100 85 55 1600 Description Maximum regular hours per worker per quarter Maximum overtime hours per worker per quarter Maximum number of workers Starting workforce Hiring cost per worker Firing cost per worker Regular time wage Overtime wage Subcontract Cost Back order cost Holding cost per pair of shoes per quarter Ending Inventory Period 0 1000 20 30 55 25 3 3000 1 2 7 8 8585 10505 Quarter Casual Athletic Running Total Aggregate Demand 3 4 5 9905 12085 14480 9250 12615 16850 9355 11990 16900 28510 36690 48230 9510 8875 8825 6 17195 17670 16150 8810 12225 14255 13525 12165 8750 13175 26145 27210 51015 40005 35845 A B D E LL F G H I J 1 CHASE AGGREGATE PLAN 2 3 4 5 6 8 1 26145 7 40005 27210 28510 36690 48230 51015 35845 23145 27210 28510 36690 48230 51015 40005 35845 0 0 0 0 0 0 0 0 0 0 48230 51015 23145 52 27210 61 28510 64 36690 82 40005 89 35845 80 55 108 114 3000 0 0 0 0 0 0 0 3000 0 1010 0 0 0 0 0 0 1500 0 0 0 0 0 0 2 3 Period 4 Forecast 5 Production 6 Regular Time 7 Overtime 8 Subcontract 9 Total Production 10 Number of Workers 11 Inventory 12 Beginning 13 Ending 14 Average 15 Backlog 16 17 Labor Costs 18 Regular 19 Overtime 20 Subcontract 21 Hire 22 Fire 23 Total Labor Cost 24 25 Inventory Costs 26 Holding Cost 27 Back Order 28 29 Total Production Cost 20 462900 544200 570200 733800 964600 1020300 800100 716900 30 55 1600 0 14400 4800 28800 41600 9600 0 0 1000 462900 3 4500 0 0 0 0 0 0 0 25 467400 30 31 Total Cost Value 450 100 85 55 1600 Description Maximum regular hours per worker per quarter Maximum overtime hours per worker per quarter Maximum number of workers Starting workforce Hiring cost per worker Firing cost per worker Regular time wage Overtime wage Subcontract Cost Back order cost Holding cost per pair of shoes per quarter Ending Inventory Period 0 1000 20 30 55 25 3 3000 1 2 7 8 8585 10505 Quarter Casual Athletic Running Total Aggregate Demand 3 4 5 9905 12085 14480 9250 12615 16850 9355 11990 16900 28510 36690 48230 9510 8875 8825 6 17195 17670 16150 8810 12225 14255 13525 12165 8750 13175 26145 27210 51015 40005 35845 A B D E LL F G H I J 1 CHASE AGGREGATE PLAN 2 3 4 5 6 8 1 26145 7 40005 27210 28510 36690 48230 51015 35845 23145 27210 28510 36690 48230 51015 40005 35845 0 0 0 0 0 0 0 0 0 0 48230 51015 23145 52 27210 61 28510 64 36690 82 40005 89 35845 80 55 108 114 3000 0 0 0 0 0 0 0 3000 0 1010 0 0 0 0 0 0 1500 0 0 0 0 0 0 2 3 Period 4 Forecast 5 Production 6 Regular Time 7 Overtime 8 Subcontract 9 Total Production 10 Number of Workers 11 Inventory 12 Beginning 13 Ending 14 Average 15 Backlog 16 17 Labor Costs 18 Regular 19 Overtime 20 Subcontract 21 Hire 22 Fire 23 Total Labor Cost 24 25 Inventory Costs 26 Holding Cost 27 Back Order 28 29 Total Production Cost 20 462900 544200 570200 733800 964600 1020300 800100 716900 30 55 1600 0 14400 4800 28800 41600 9600 0 0 1000 462900 3 4500 0 0 0 0 0 0 0 25 467400 30 31 Total Cost

Step by Step Solution

There are 3 Steps involved in it

1 Expert Approved Answer
Step: 1 Unlock blur-text-image
Question Has Been Solved by an Expert!

Get step-by-step solutions from verified subject matter experts

Step: 2 Unlock
Step: 3 Unlock

Students Have Also Explored These Related General Management Questions!