

Question: value between 1 and 1 0 , where 1 is the least risky and 1 0 is the most risky. Ajax would like to visualize
value between and where is the least risky and is the most risky. Ajax would like to visualize their current R&D projects to keep track of the overall risk and return of their R&D iv
Select your answer
b Select your answer
Graph i
Graph ii
Graph iii
Graph iv
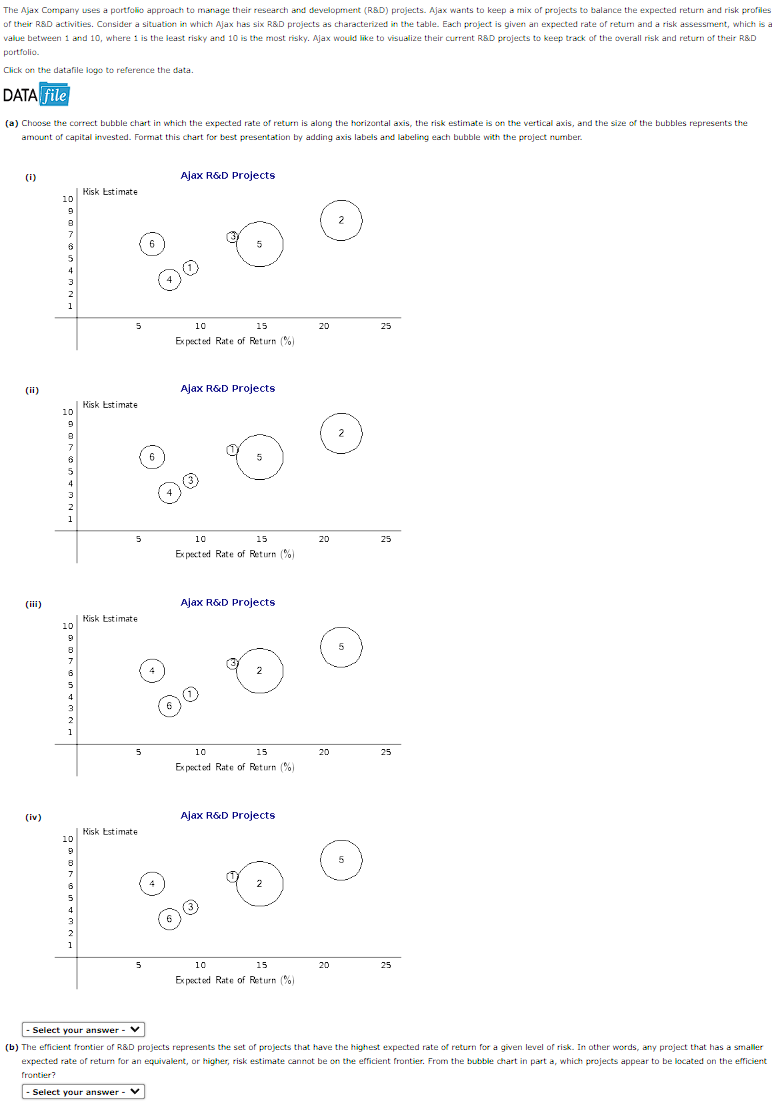
Ajax R&D Projects b The efficient frontier of R&D projects represents the set of projects that have the highest expected rate of return for a given level of risk. In other words, any project that has a smaller
expected rate of return for an equivalent, or higher, risk estimate cannot be on the efficient frontier. From the bubble chart in part a which projects appear to be located on the efficient
frontier?
Select your answer
Select your answer
portfolio.
Click on the datafile logo to reference the data.
DATA file
a Choose the correct bubble chart in which the expected rate of return is along the horizontal axis, the risk estimate is on the vertical axis, and the size of the bubbles represents the
amount of capital invested. Format this chart for best presentation by adding axis labels and labeling each bubble with the project number.
i
ii
Alay R&n Drolecte
iii
Ajax RoD Projects
iv
Alax R&D Projects
expected rate of return for an equivalent, or higher, risk estimate cannot be on the efficient frontier. From the bubble chart in part a which projects appear to be located on the efficient
frontier?
Step by Step Solution
There are 3 Steps involved in it
1 Expert Approved Answer
Step: 1 Unlock

Question Has Been Solved by an Expert!
Get step-by-step solutions from verified subject matter experts
Step: 2 Unlock
Step: 3 Unlock