

Question: Value USG based on its current operating and financial strategies and how does it compare to it's current market price? Exhibit 2 USG Corporation Consolidated
Value USG based on its current operating and financial strategies and how does it compare to it's current market price?
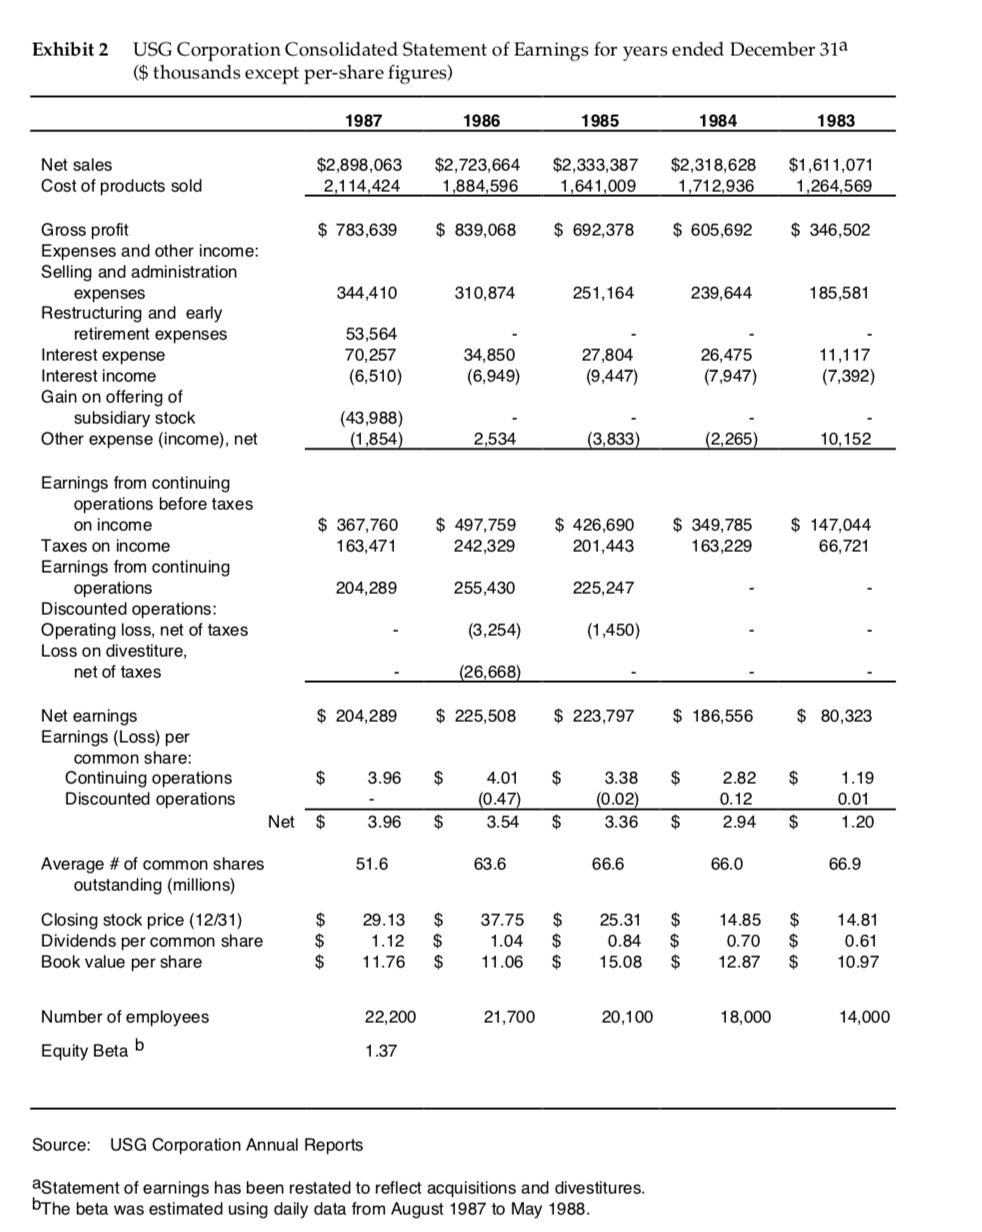
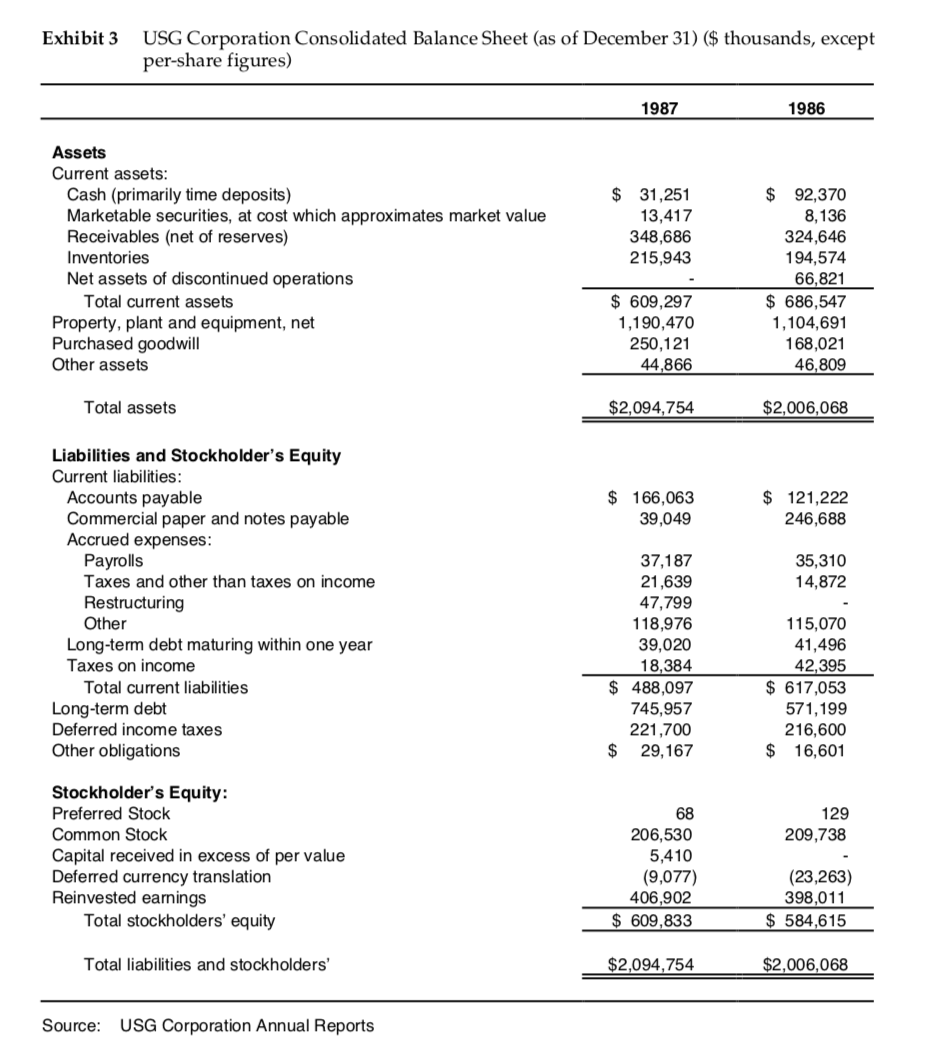
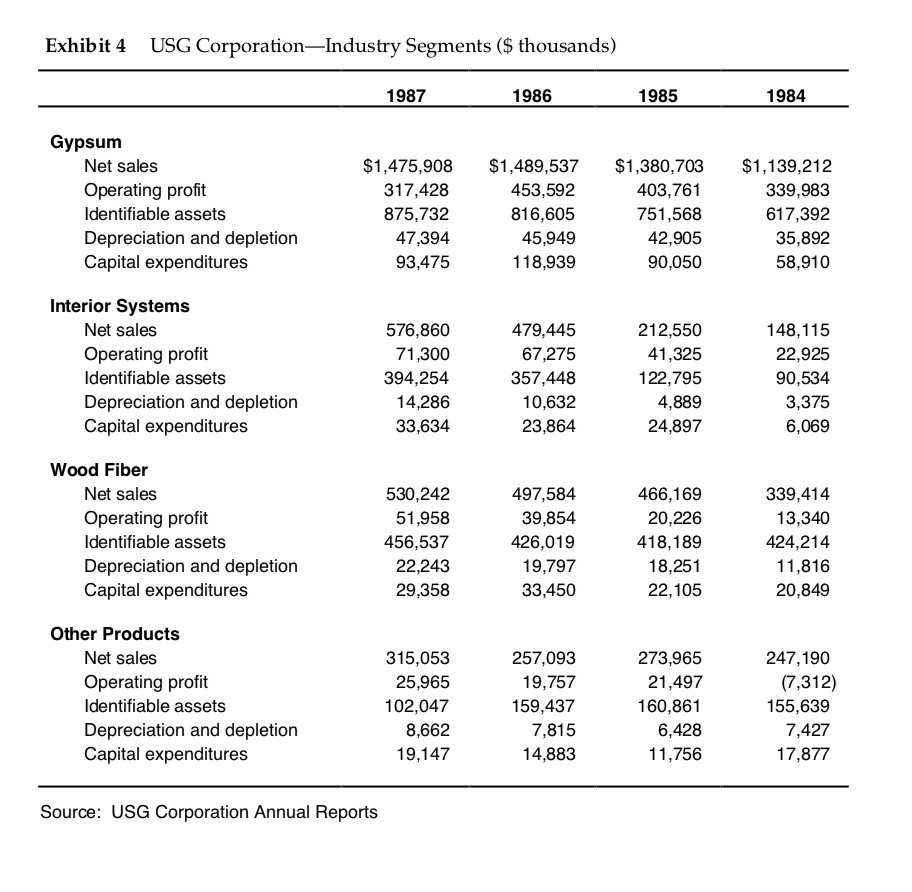
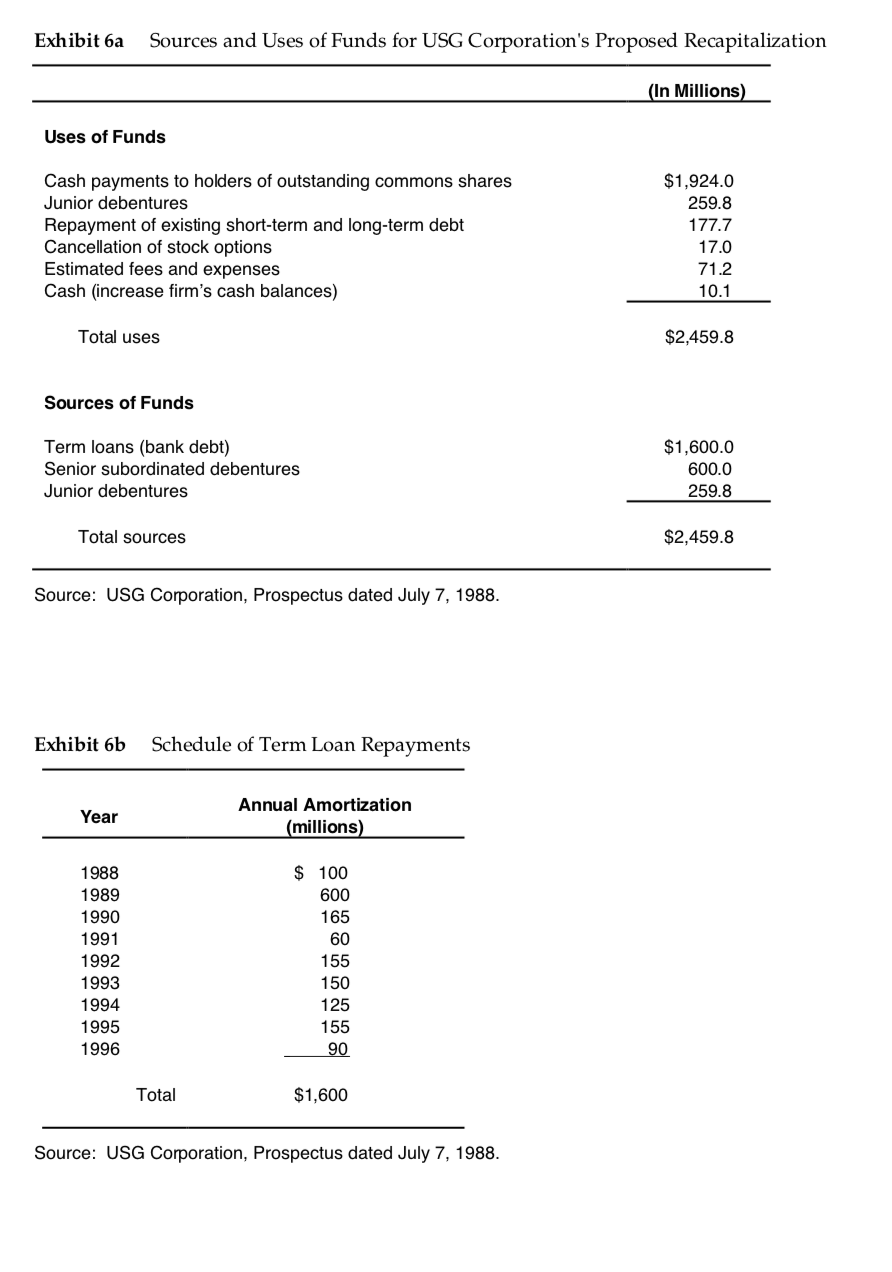
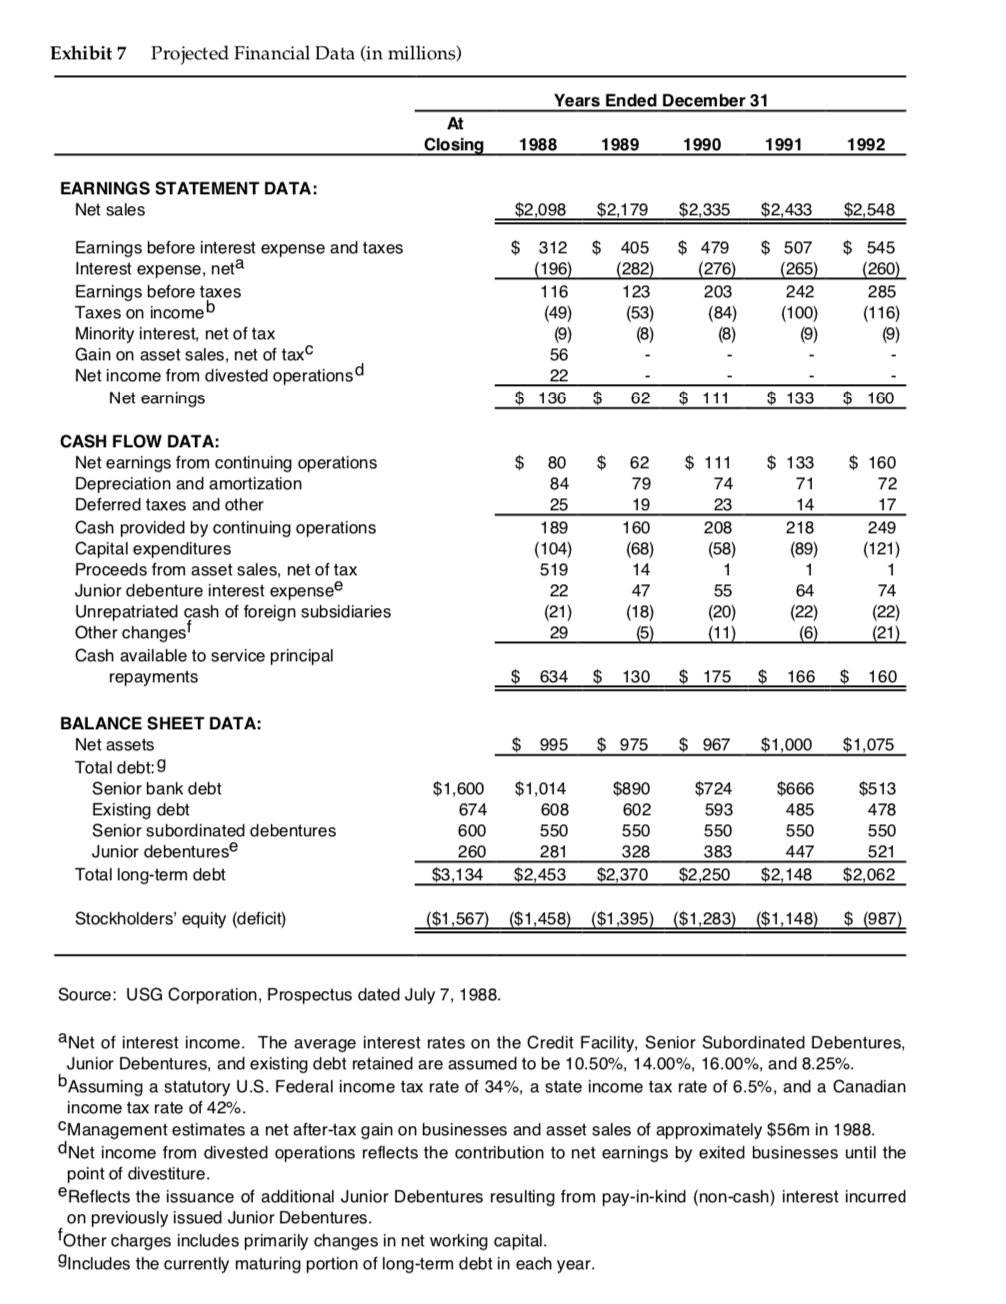
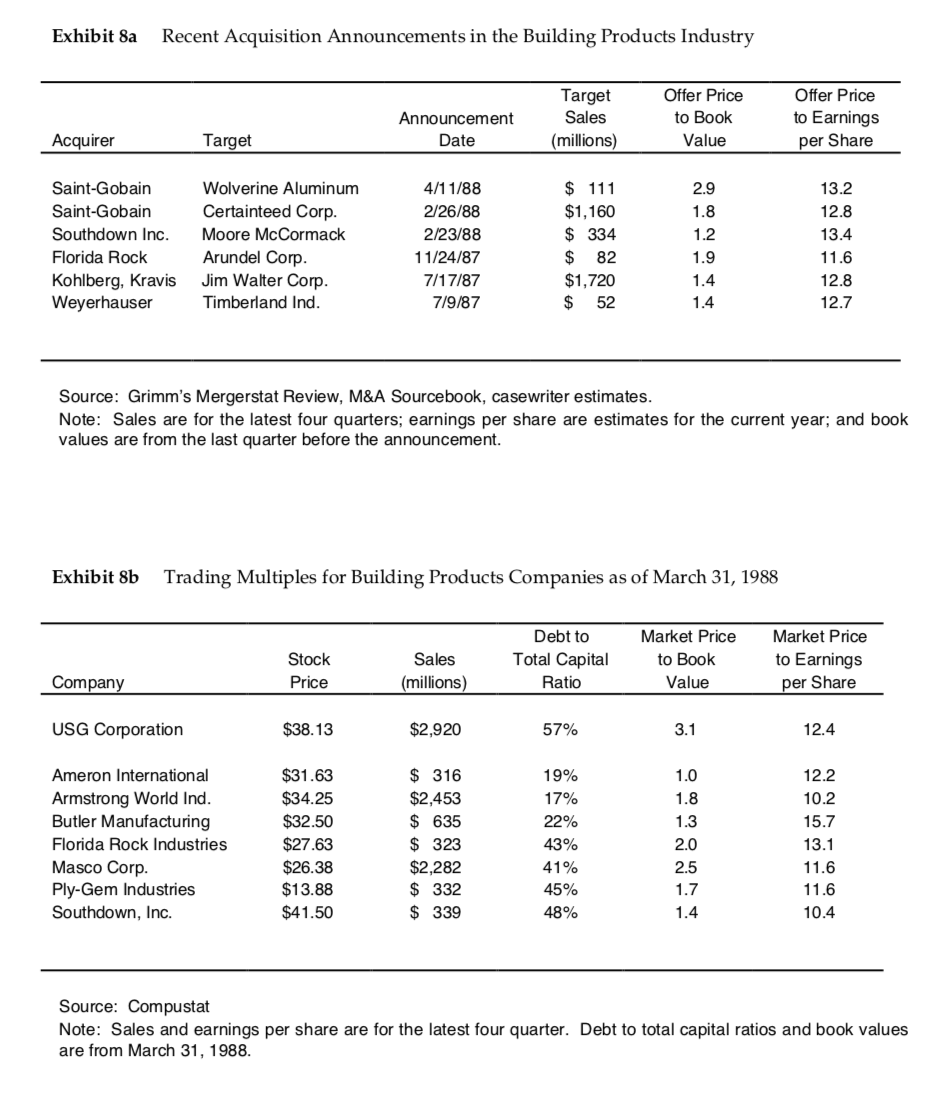
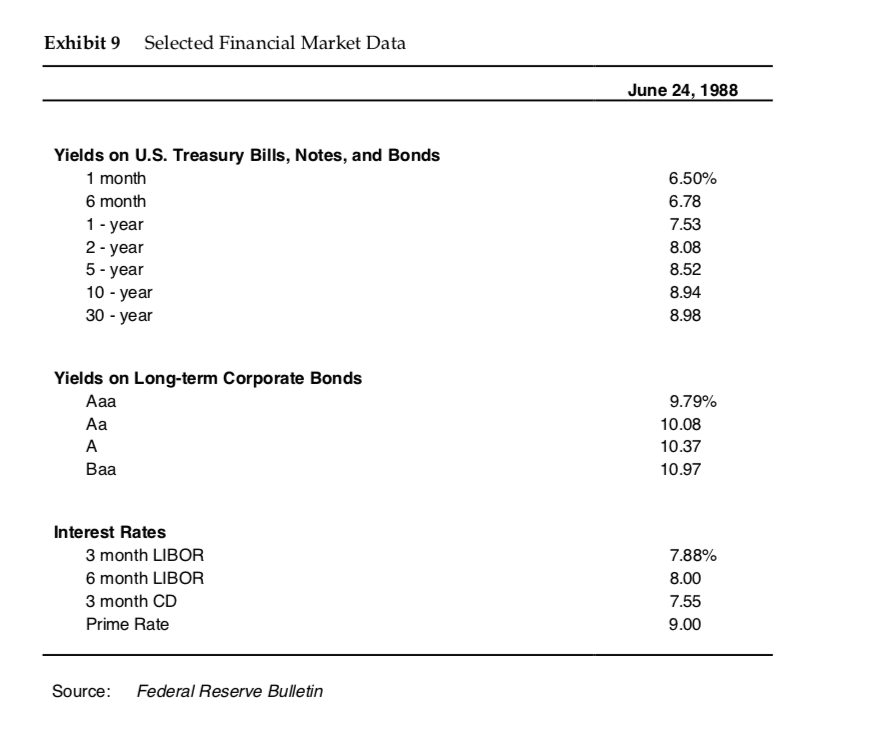
Exhibit 2 USG Corporation Consolidated Statement of Earnings for years ended December 31a ($ thousands except per-share figures) 1987 1986 1985 1984 1983 Net sales Cost of products sold $2,898,063 2,114,424 $2,723,664 1,884,596 $2,333,387 1,641,009 $2,318,628 1,712,936 $1,611,071 1,264,569 $ 783,639 $ 839,068 $ 692,378 $ 605,692 $ 346,502 344,410 310,874 251,164 239,644 185,581 Gross profit Expenses and other income: Selling and administration expenses Restructuring and early retirement expenses Interest expense Interest income Gain on offering of subsidiary stock Other expense (income), net 53,564 70,257 (6,510) 11,117 34,850 (6,949) 27,804 (9,447) 26,475 (7,947) (7,392) (43,988) (1,854) 2,534 (3,833) (2,265) 10,152 $ 367,760 163,471 $ 497,759 242,329 $ 426,690 201,443 $ 349,785 163,229 $ 147,044 66,721 Earnings from continuing operations before taxes on income Taxes on income Earnings from continuing operations Discounted operations: Operating loss, net of taxes Loss on divestiture, net of taxes 204,289 255,430 225,247 (3,254) (1,450) (26,668) $ 204,289 $ 225,508 $ 223,797 $ 186,556 $ 80,323 Net earnings Earnings (Loss) per common share: Continuing operations Discounted operations $ 3.96 $ $ $ $ 4.01 (0.47) 3.54 3.38 (0.02) 3.36 2.82 0.12 2.94 1.19 0.01 1.20 Net $ 3.96 $ $ $ $ 51.6 63.6 66.6 66.0 66.9 Average # of common shares outstanding (millions) Closing stock price (12/31) Dividends per common share Book value per share $ $ 29.13 1.12 11.76 $ $ $ 37.75 1.04 11.06 $ $ $ 25.31 0.84 15.08 $ $ $ A 14.85 0.70 12.87 $ $ $ 14.81 0.61 10.97 22,200 21,700 20,100 18,000 14,000 Number of employees Equity Beta b 1.37 Source: USG Corporation Annual Reports astatement of earnings has been restated to reflect acquisitions and divestitures. bThe beta was estimated using daily data from August 1987 to May 1988. Exhibit 3 USG Corporation Consolidated Balance Sheet (as of December 31) ($ thousands, except per-share figures) 1987 1986 $ Assets Current assets: Cash (primarily time deposits) Marketable securities, at cost which approximates market value Receivables (net of reserves) Inventories Net assets of discontinued operations Total current assets Property, plant and equipment, net Purchased goodwill Other assets 31,251 13,417 348,686 215,943 $ 92,370 8,136 324,646 194,574 66,821 $ 686,547 1,104,691 168,021 46,809 $ 609,297 1,190.470 250,121 44,866 Total assets $2,094,754 $2,006,068 $ 166,063 39,049 $ 121,222 246,688 35,310 14,872 Liabilities and Stockholder's Equity Current liabilities: Accounts payable Commercial paper and notes payable Accrued expenses: Payrolls Taxes and other than taxes on income Restructuring Other Long-term debt maturing within one year Taxes on income Total current liabilities Long-term debt Deferred income taxes Other obligations 37,187 21,639 47,799 118,976 39,020 18,384 $ 488,097 745,957 221,700 $ 29,167 115,070 41,496 42,395 $ 617,053 571,199 216,600 $ 16,601 129 209,738 Stockholder's Equity: Preferred Stock Common Stock Capital received in excess of per value Deferred currency translation Reinvested earnings Total stockholders' equity 68 206,530 5,410 (9,077) 406,902 $ 609,833 (23,263) 398,011 $ 584,615 Total liabilities and stockholders' $2,094,754 $2,006,068 Source: USG Corporation Annual Reports Exhibit 4 USG CorporationIndustry Segments ($ thousands) 1987 1986 1985 1984 Gypsum Net sales Operating profit Identifiable assets Depreciation and depletion Capital expenditures $1,475,908 317,428 875,732 47,394 93,475 $1,489,537 453,592 816,605 45,949 118.939 $1,380,703 403,761 751,568 42,905 90,050 $1,139,212 339,983 617,392 35.892 58,910 Interior Systems Net sales Operating profit Identifiable assets Depreciation and depletion Capital expenditures 576,860 71,300 394,254 14,286 33,634 479,445 67,275 357,448 10,632 23,864 212,550 41.325 122,795 4,889 24,897 148,115 22,925 90,534 3,375 6,069 Wood Fiber Net sales Operating profit Identifiable assets Depreciation and depletion Capital expenditures 530.242 51,958 456.537 22.243 29,358 497,584 39,854 426,019 19,797 33,450 466,169 20,226 418,189 18,251 22,105 339,414 13,340 424,214 11,816 20,849 Other Products Net sales Operating profit Identifiable assets Depreciation and depletion Capital expenditures 315,053 25,965 102,047 8,662 19,147 257,093 19.757 159,437 7,815 14,883 273,965 21,497 160,861 6,428 11,756 247,190 (7,312) 155,639 7,427 17,877 Source: USG Corporation Annual Reports Exhibit 6a Sources and Uses of Funds for USG Corporation's Proposed Recapitalization (In Millions) Uses of Funds Cash payments to holders of outstanding commons shares Junior debentures Repayment of existing short-term and long-term debt Cancellation of stock options Estimated fees and expenses Cash (increase firm's cash balances) $1,924.0 259.8 177.7 17.0 71.2 10.1 Total uses $2,459.8 Sources of Funds Term loans (bank debt) Senior subordinated debentures Junior debentures $1,600.0 600.0 259.8 Total sources $2,459.8 Source: USG Corporation, Prospectus dated July 7, 1988. Exhibit 6b Schedule of Term Loan Repayments Year Annual Amortization (millions) 1988 1989 1990 1991 1992 1993 1994 1995 1996 $ 100 600 165 60 155 150 125 155 90 Total $1,600 Source: USG Corporation, Prospectus dated July 7, 1988. Exhibit 7 Projected Financial Data (in millions) Years Ended December 31 At Closing 1988 1989 1990 1991 1992 EARNINGS STATEMENT DATA: Net sales $2,098 $2,179 $2,335 $2,433 $2,548 $ $ $ 545 (260) Earnings before interest expense and taxes Interest expense, neta Earnings before taxes Taxes on income Minority interest, net of tax Gain on asset sales, net of tax Net income from divested operations Net earnings 312 (196) 116 (49) (9) 56 405 (282) 123 (53) (8) $ 479 (276) 203 (84) (8) $ 507 (265) 242 (100) (9) 285 (116) (9) $ 136 $ 62 $ 111 $ 133 $ 160 $ $ 111 74 23 $ 133 71 14 84 25 189 (104) 519 62 79 19 160 (68) 14 $ 160 72 17 249 (121) CASH FLOW DATA: Net earnings from continuing operations Depreciation and amortization Deferred taxes and other Cash provided by continuing operations Capital expenditures Proceeds from asset sales, net of tax Junior debenture interest expensee Unrepatriated cash of foreign subsidiaries Other changes Cash available to service principal repayments 208 (58) 218 (89) 22 47 55 (20) (21) 29 (18) (5) (11) (6) (21) $ 634 $ 130 $ 175 $ 166 $ 160 $ 995 $ 975 $ 967 $1,000 $1,075 BALANCE SHEET DATA: Net assets Total debt:9 Senior bank debt Existing debt Senior subordinated debentures Junior debenturese Total long-term debt $513 478 $1,600 674 600 260 $3,134 $1,014 608 550 281 $2,453 $890 602 550 328 $2,370 $724 593 550 383 $2,250 $666 485 550 4 47 $2,148 550 521 $2,062 Stockholders' equity (deficit) ($1,567) ($1,458) ($1,395) ($1,283) ($1,148) $ (987) Source: USG Corporation, Prospectus dated July 7, 1988. aNet of interest income. The average interest rates on the Credit Facility, Senior Subordinated Debentures, Junior Debentures, and existing debt retained are assumed to be 10.50%, 14.00%, 16.00%, and 8.25%. bAssuming a statutory U.S. Federal income tax rate of 34%, a state income tax rate of 6.5%, and a Canadian income tax rate of 42%. Management estimates a net after-tax gain on businesses and asset sales of approximately $56m in 1988. dNet income from divested operations reflects the contribution to net earnings by exited businesses until the point of divestiture. Reflects the issuance of additional Junior Debentures resulting from pay-in-kind (non-cash) interest incurred on previously issued Junior Debentures. Other charges includes primarily changes in net working capital. 9includes the currently maturing portion of long-term debt in each year. Exhibit 8a Recent Acquisition Announcements in the Building Products Industry Announcement Date Target Sales (millions) Offer Price to Book Value Offer Price to Earnings per Share Acquirer Target 2.9 Saint-Gobain Saint-Gobain Southdown Inc. Florida Rock Kohlberg, Kravis Weyerhauser Wolverine Aluminum Certainteed Corp. Moore McCormack Arundel Corp. Jim Walter Corp. Timberland Ind. 4/1 1/88 2/26/88 2/23/88 11/24/87 7/17/87 7/9/87 $ 111 $1,160 $ 334 $ 82 $1,720 $ 52 13.2 12.8 13.4 11.6 12.8 12.7 Source: Grimm's Mergerstat Review, M&A Sourcebook, casewriter estimates. Note: Sales are for the latest four quarters, earnings per share are estimates for the current year; and book values are from the last quarter before the announcement. Exhibit 8b Trading Multiples for Building Products Companies as of March 31, 1988 Stock Price Sales (millions) Debt to Total Capital Ratio Market Price to Book Value Market Price to Earnings per Share Company USG Corporation $38.13 $2,920 57% 3.1 12.4 12.2 10.2 15.7 Ameron International Armstrong World Ind. Butler Manufacturing Florida Rock Industries Masco Corp. Ply-Gem Industries Southdown, Inc. $31.63 $34.25 $32.50 $27.63 $26.38 $13.88 $41.50 $ 316 $2,453 $ 635 $ 323 $2,282 $ 332 $ 339 19% 17% 22% 43% 41% 45% 48% 13.1 11.6 11.6 10.4 Source: Compustat Note: Sales and earnings per share are for the latest four quarter. Debt to total capital ratios and book values are from March 31, 1988. Exhibit 9 Selected Financial Market Data June 24, 1988 Yields on U.S. Treasury Bills, Notes, and Bonds 1 month 6 month 1 - year 2-year 5-year 10-year 30 - year 6.50% 6.78 7.53 8.08 8.52 8.94 8.98 Yields on Long-term Corporate Bonds Aaa Aa 9.79% 10.08 10.37 10.97 Baa Interest Rates 3 month LIBOR 6 month LIBOR 3 month CD Prime Rate 7.88% 8.00 7.55 9.00 Source: Federal Reserve Bulletin Exhibit 2 USG Corporation Consolidated Statement of Earnings for years ended December 31a ($ thousands except per-share figures) 1987 1986 1985 1984 1983 Net sales Cost of products sold $2,898,063 2,114,424 $2,723,664 1,884,596 $2,333,387 1,641,009 $2,318,628 1,712,936 $1,611,071 1,264,569 $ 783,639 $ 839,068 $ 692,378 $ 605,692 $ 346,502 344,410 310,874 251,164 239,644 185,581 Gross profit Expenses and other income: Selling and administration expenses Restructuring and early retirement expenses Interest expense Interest income Gain on offering of subsidiary stock Other expense (income), net 53,564 70,257 (6,510) 11,117 34,850 (6,949) 27,804 (9,447) 26,475 (7,947) (7,392) (43,988) (1,854) 2,534 (3,833) (2,265) 10,152 $ 367,760 163,471 $ 497,759 242,329 $ 426,690 201,443 $ 349,785 163,229 $ 147,044 66,721 Earnings from continuing operations before taxes on income Taxes on income Earnings from continuing operations Discounted operations: Operating loss, net of taxes Loss on divestiture, net of taxes 204,289 255,430 225,247 (3,254) (1,450) (26,668) $ 204,289 $ 225,508 $ 223,797 $ 186,556 $ 80,323 Net earnings Earnings (Loss) per common share: Continuing operations Discounted operations $ 3.96 $ $ $ $ 4.01 (0.47) 3.54 3.38 (0.02) 3.36 2.82 0.12 2.94 1.19 0.01 1.20 Net $ 3.96 $ $ $ $ 51.6 63.6 66.6 66.0 66.9 Average # of common shares outstanding (millions) Closing stock price (12/31) Dividends per common share Book value per share $ $ 29.13 1.12 11.76 $ $ $ 37.75 1.04 11.06 $ $ $ 25.31 0.84 15.08 $ $ $ A 14.85 0.70 12.87 $ $ $ 14.81 0.61 10.97 22,200 21,700 20,100 18,000 14,000 Number of employees Equity Beta b 1.37 Source: USG Corporation Annual Reports astatement of earnings has been restated to reflect acquisitions and divestitures. bThe beta was estimated using daily data from August 1987 to May 1988. Exhibit 3 USG Corporation Consolidated Balance Sheet (as of December 31) ($ thousands, except per-share figures) 1987 1986 $ Assets Current assets: Cash (primarily time deposits) Marketable securities, at cost which approximates market value Receivables (net of reserves) Inventories Net assets of discontinued operations Total current assets Property, plant and equipment, net Purchased goodwill Other assets 31,251 13,417 348,686 215,943 $ 92,370 8,136 324,646 194,574 66,821 $ 686,547 1,104,691 168,021 46,809 $ 609,297 1,190.470 250,121 44,866 Total assets $2,094,754 $2,006,068 $ 166,063 39,049 $ 121,222 246,688 35,310 14,872 Liabilities and Stockholder's Equity Current liabilities: Accounts payable Commercial paper and notes payable Accrued expenses: Payrolls Taxes and other than taxes on income Restructuring Other Long-term debt maturing within one year Taxes on income Total current liabilities Long-term debt Deferred income taxes Other obligations 37,187 21,639 47,799 118,976 39,020 18,384 $ 488,097 745,957 221,700 $ 29,167 115,070 41,496 42,395 $ 617,053 571,199 216,600 $ 16,601 129 209,738 Stockholder's Equity: Preferred Stock Common Stock Capital received in excess of per value Deferred currency translation Reinvested earnings Total stockholders' equity 68 206,530 5,410 (9,077) 406,902 $ 609,833 (23,263) 398,011 $ 584,615 Total liabilities and stockholders' $2,094,754 $2,006,068 Source: USG Corporation Annual Reports Exhibit 4 USG CorporationIndustry Segments ($ thousands) 1987 1986 1985 1984 Gypsum Net sales Operating profit Identifiable assets Depreciation and depletion Capital expenditures $1,475,908 317,428 875,732 47,394 93,475 $1,489,537 453,592 816,605 45,949 118.939 $1,380,703 403,761 751,568 42,905 90,050 $1,139,212 339,983 617,392 35.892 58,910 Interior Systems Net sales Operating profit Identifiable assets Depreciation and depletion Capital expenditures 576,860 71,300 394,254 14,286 33,634 479,445 67,275 357,448 10,632 23,864 212,550 41.325 122,795 4,889 24,897 148,115 22,925 90,534 3,375 6,069 Wood Fiber Net sales Operating profit Identifiable assets Depreciation and depletion Capital expenditures 530.242 51,958 456.537 22.243 29,358 497,584 39,854 426,019 19,797 33,450 466,169 20,226 418,189 18,251 22,105 339,414 13,340 424,214 11,816 20,849 Other Products Net sales Operating profit Identifiable assets Depreciation and depletion Capital expenditures 315,053 25,965 102,047 8,662 19,147 257,093 19.757 159,437 7,815 14,883 273,965 21,497 160,861 6,428 11,756 247,190 (7,312) 155,639 7,427 17,877 Source: USG Corporation Annual Reports Exhibit 6a Sources and Uses of Funds for USG Corporation's Proposed Recapitalization (In Millions) Uses of Funds Cash payments to holders of outstanding commons shares Junior debentures Repayment of existing short-term and long-term debt Cancellation of stock options Estimated fees and expenses Cash (increase firm's cash balances) $1,924.0 259.8 177.7 17.0 71.2 10.1 Total uses $2,459.8 Sources of Funds Term loans (bank debt) Senior subordinated debentures Junior debentures $1,600.0 600.0 259.8 Total sources $2,459.8 Source: USG Corporation, Prospectus dated July 7, 1988. Exhibit 6b Schedule of Term Loan Repayments Year Annual Amortization (millions) 1988 1989 1990 1991 1992 1993 1994 1995 1996 $ 100 600 165 60 155 150 125 155 90 Total $1,600 Source: USG Corporation, Prospectus dated July 7, 1988. Exhibit 7 Projected Financial Data (in millions) Years Ended December 31 At Closing 1988 1989 1990 1991 1992 EARNINGS STATEMENT DATA: Net sales $2,098 $2,179 $2,335 $2,433 $2,548 $ $ $ 545 (260) Earnings before interest expense and taxes Interest expense, neta Earnings before taxes Taxes on income Minority interest, net of tax Gain on asset sales, net of tax Net income from divested operations Net earnings 312 (196) 116 (49) (9) 56 405 (282) 123 (53) (8) $ 479 (276) 203 (84) (8) $ 507 (265) 242 (100) (9) 285 (116) (9) $ 136 $ 62 $ 111 $ 133 $ 160 $ $ 111 74 23 $ 133 71 14 84 25 189 (104) 519 62 79 19 160 (68) 14 $ 160 72 17 249 (121) CASH FLOW DATA: Net earnings from continuing operations Depreciation and amortization Deferred taxes and other Cash provided by continuing operations Capital expenditures Proceeds from asset sales, net of tax Junior debenture interest expensee Unrepatriated cash of foreign subsidiaries Other changes Cash available to service principal repayments 208 (58) 218 (89) 22 47 55 (20) (21) 29 (18) (5) (11) (6) (21) $ 634 $ 130 $ 175 $ 166 $ 160 $ 995 $ 975 $ 967 $1,000 $1,075 BALANCE SHEET DATA: Net assets Total debt:9 Senior bank debt Existing debt Senior subordinated debentures Junior debenturese Total long-term debt $513 478 $1,600 674 600 260 $3,134 $1,014 608 550 281 $2,453 $890 602 550 328 $2,370 $724 593 550 383 $2,250 $666 485 550 4 47 $2,148 550 521 $2,062 Stockholders' equity (deficit) ($1,567) ($1,458) ($1,395) ($1,283) ($1,148) $ (987) Source: USG Corporation, Prospectus dated July 7, 1988. aNet of interest income. The average interest rates on the Credit Facility, Senior Subordinated Debentures, Junior Debentures, and existing debt retained are assumed to be 10.50%, 14.00%, 16.00%, and 8.25%. bAssuming a statutory U.S. Federal income tax rate of 34%, a state income tax rate of 6.5%, and a Canadian income tax rate of 42%. Management estimates a net after-tax gain on businesses and asset sales of approximately $56m in 1988. dNet income from divested operations reflects the contribution to net earnings by exited businesses until the point of divestiture. Reflects the issuance of additional Junior Debentures resulting from pay-in-kind (non-cash) interest incurred on previously issued Junior Debentures. Other charges includes primarily changes in net working capital. 9includes the currently maturing portion of long-term debt in each year. Exhibit 8a Recent Acquisition Announcements in the Building Products Industry Announcement Date Target Sales (millions) Offer Price to Book Value Offer Price to Earnings per Share Acquirer Target 2.9 Saint-Gobain Saint-Gobain Southdown Inc. Florida Rock Kohlberg, Kravis Weyerhauser Wolverine Aluminum Certainteed Corp. Moore McCormack Arundel Corp. Jim Walter Corp. Timberland Ind. 4/1 1/88 2/26/88 2/23/88 11/24/87 7/17/87 7/9/87 $ 111 $1,160 $ 334 $ 82 $1,720 $ 52 13.2 12.8 13.4 11.6 12.8 12.7 Source: Grimm's Mergerstat Review, M&A Sourcebook, casewriter estimates. Note: Sales are for the latest four quarters, earnings per share are estimates for the current year; and book values are from the last quarter before the announcement. Exhibit 8b Trading Multiples for Building Products Companies as of March 31, 1988 Stock Price Sales (millions) Debt to Total Capital Ratio Market Price to Book Value Market Price to Earnings per Share Company USG Corporation $38.13 $2,920 57% 3.1 12.4 12.2 10.2 15.7 Ameron International Armstrong World Ind. Butler Manufacturing Florida Rock Industries Masco Corp. Ply-Gem Industries Southdown, Inc. $31.63 $34.25 $32.50 $27.63 $26.38 $13.88 $41.50 $ 316 $2,453 $ 635 $ 323 $2,282 $ 332 $ 339 19% 17% 22% 43% 41% 45% 48% 13.1 11.6 11.6 10.4 Source: Compustat Note: Sales and earnings per share are for the latest four quarter. Debt to total capital ratios and book values are from March 31, 1988. Exhibit 9 Selected Financial Market Data June 24, 1988 Yields on U.S. Treasury Bills, Notes, and Bonds 1 month 6 month 1 - year 2-year 5-year 10-year 30 - year 6.50% 6.78 7.53 8.08 8.52 8.94 8.98 Yields on Long-term Corporate Bonds Aaa Aa 9.79% 10.08 10.37 10.97 Baa Interest Rates 3 month LIBOR 6 month LIBOR 3 month CD Prime Rate 7.88% 8.00 7.55 9.00 Source: Federal Reserve Bulletin
Step by Step Solution
There are 3 Steps involved in it

Get step-by-step solutions from verified subject matter experts