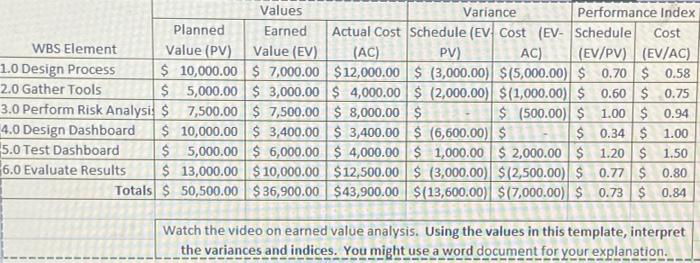
Question: Values Variance Performance Index Planned Earned Actual Cost Schedule (EV. Cost (EV- Schedule Cost WBS Element Value (PV) Value (EV) (AC) PV) AC) (EV/PV) (EV/AC)

Values Variance Performance Index Planned Earned
Values Variance Performance Index Planned Earned Actual Cost Schedule (EV. Cost (EV- Schedule Cost WBS Element Value (PV) Value (EV) (AC) PV) AC) (EV/PV) (EV/AC) 1.0 Design Process $ 10,000.00 $ 7,000.00 $12,000.00 $ (3,000.00) $(5,000.00) $ 0.70 $ 0.58 2.0 Gather Tools $ 5,000.00 $ 3,000.00 $ 4,000.00 $ (2,000.00) $(1,000.00) $ 0.60 $ 0.75 3.0 Perform Risk Analysis $ 7,500.00 $ 7,500.00 $ 8,000.00 $ $ (500.00) $ 1.00 $ 0.94 4.0 Design Dashboard $ 10,000.00 $ 3,400.00 $ 3,400.00 $ (6,600.00) $ $ 0.34 $ 1.00 5.0 Test Dashboard $ 5,000.00 $ 6,000.00 $ 4,000.00 $ 1,000.00 $ 2,000.00 $ 1.20 $ 1.50 6.0 Evaluate Results $ 13,000.00 $ 10,000.00 $12,500.00 $ (3,000.00) $12,500.00) $ 0.77 $ 0.80 Totals $ 50,500.00 $ 36,900.00 $43,900.00 $(13,600.00) $(7,000.00) $ 0.73 $ 0.84 Watch the video on earned value analysis. Using the values in this template, interpret the variances and indices. You might use a word document for your explanation

Step by Step Solution

There are 3 Steps involved in it

1 Expert Approved Answer
Step: 1 Unlock blur-text-image
Question Has Been Solved by an Expert!

Get step-by-step solutions from verified subject matter experts

Step: 2 Unlock
Step: 3 Unlock

Students Have Also Explored These Related General Management Questions!