

Question: Variance Drain Approximation Recall the formula from the Variance Drain notes (use same notation): 1 RA RG + 720 The issue raised in the
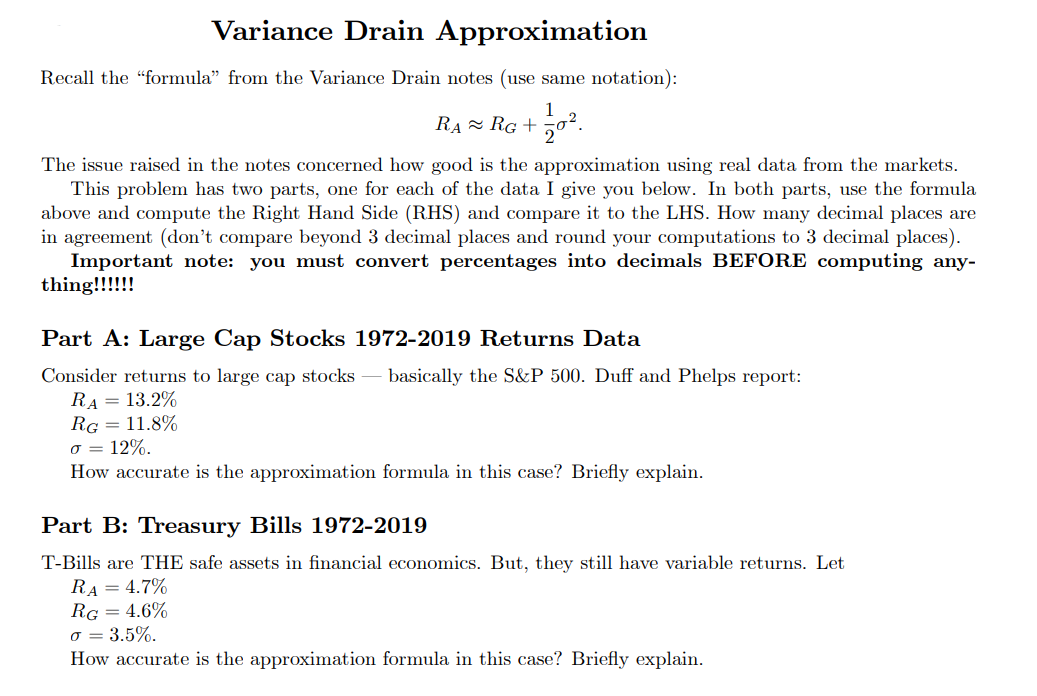
Variance Drain Approximation Recall the "formula" from the Variance Drain notes (use same notation): 1 RA RG + 720 The issue raised in the notes concerned how good is the approximation using real data from the markets. This problem has two parts, one for each of the data I give you below. In both parts, use the formula above and compute the Right Hand Side (RHS) and compare it to the LHS. How many decimal places are in agreement (don't compare beyond 3 decimal places and round your computations to 3 decimal places). Important note: you must convert percentages into decimals BEFORE computing any- thing!!!!!! Part A: Large Cap Stocks 1972-2019 Returns Data Consider returns to large cap stocks basically the S&P 500. Duff and Phelps report: RA = 13.2% RG = 11.8% = 12%. How accurate is the approximation formula in this case? Briefly explain. Part B: Treasury Bills 1972-2019 T-Bills are THE safe assets in financial economics. But, they still have variable returns. Let RA = 4.7% RG = 4.6% = 3.5%. How accurate is the approximation formula in this case? Briefly explain.
Step by Step Solution
There are 3 Steps involved in it

Get step-by-step solutions from verified subject matter experts