

Question: Variation in packaging weights is increasing, resulting in larger than usual packaged weights following the previous question, we can conclude the process is out of
Variation in packaging weights is increasing, resulting in larger than usual packaged weights
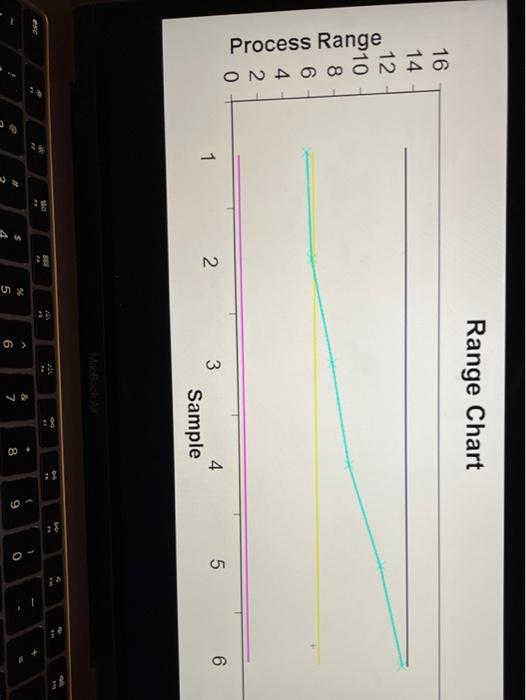
R Chart: data exceed the UCL/Lcl range
R Chart: systematic oscillation
R Chart: consectuve poitne above/below the CL
R Chart: Trend
X Bar Chart: Data exceed thr UCL/LCL range
X Bar Chart: Consecutive points above/beliw tbe CL
X Bar Chart: Trend
SELECT ALL THAT APPLY 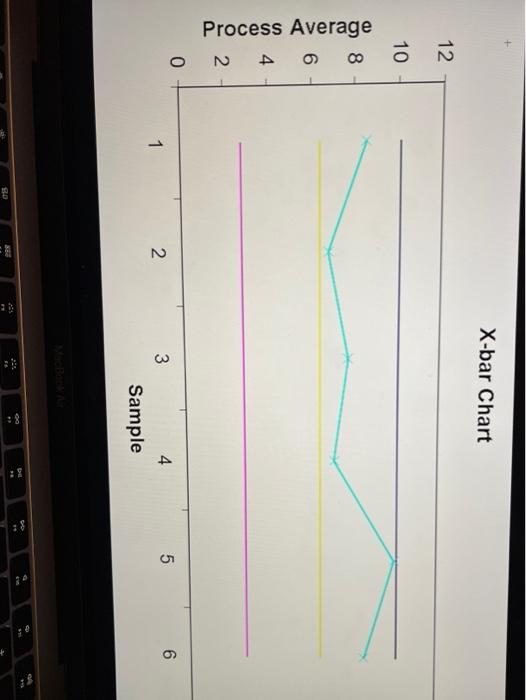
Step by Step Solution
There are 3 Steps involved in it
1 Expert Approved Answer
Step: 1 Unlock

Question Has Been Solved by an Expert!
Get step-by-step solutions from verified subject matter experts
Step: 2 Unlock
Step: 3 Unlock