

Question: very confused about how to solve this problem. How do you create a list using only the temperature values? please help tuser inputs file nane
very confused about how to solve this problem. How do you create a list using only the temperature values? please help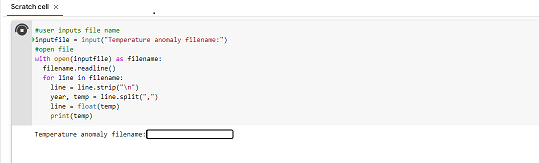
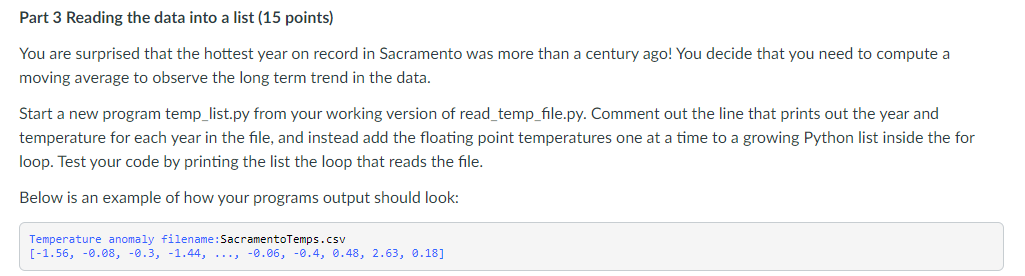
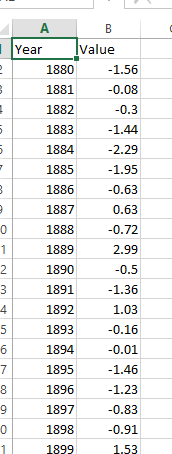
tuser inputs file nane 5nputfile = Input("Tenperature anoely fs1enans:"3 topen file wIth opsn(1nputf11e) as filenase: filensme, readline(') for lsine in flienans: line = line, stripi ("n2) yean, temp =11n sisplit (,") line = flost(temp) print (tens) Temperature anomaly filenare: Part 3 Reading the data into a list ( 15 points) You are surprised that the hottest year on record in Sacramento was more than a century ago! You decide that you need to compute a moving average to observe the long term trend in the data. Start a new program temp_list.py from your working version of read_temp_file.py. Comment out the line that prints out the year and temperature for each year in the file, and instead add the floating point temperatures one at a time to a growing Python list inside the for loop. Test your code by printing the list the loop that reads the file. Below is an example of how your programs output should look: Temperature anomaly filename:SacramentoTemps.csv [1.56,0.08,0.3,1.44,,0.06,0.4,0.48,2.63,0.18] \begin{tabular}{|l|r|r|} \hline \multicolumn{1}{|c|}{ A } & \multicolumn{1}{c|}{ B } \\ \hline \multicolumn{1}{|c|}{ Year } & \multicolumn{1}{c|}{ Value } \\ \hline & 1880 & 1.56 \\ \hline & 1881 & 0.08 \\ \hline 1882 & 0.3 \\ \hline & 1883 & 1.44 \\ \hline & 1884 & 2.29 \\ \hline & 1885 & 1.95 \\ \hline & 1886 & 0.63 \\ \hline 1 & 1887 & 0.63 \\ \hline 2 & 1888 & 0.72 \\ \hline 3 & 1889 & 2.99 \\ \hline 4 & 1890 & 0.5 \\ \hline 5 & 1891 & 1.36 \\ \hline 6 & 1893 & 1.03 \\ \hline 7 & 1894 & 0.16 \\ \hline 8 & 1896 & 1.46 \\ \hline 9 & 1897 & 1.23 \\ \hline 0 & 1898 & 0.83 \\ \hline 1 & 1899 & 1.53 \\ \hline \end{tabular}
Step by Step Solution
There are 3 Steps involved in it

Get step-by-step solutions from verified subject matter experts