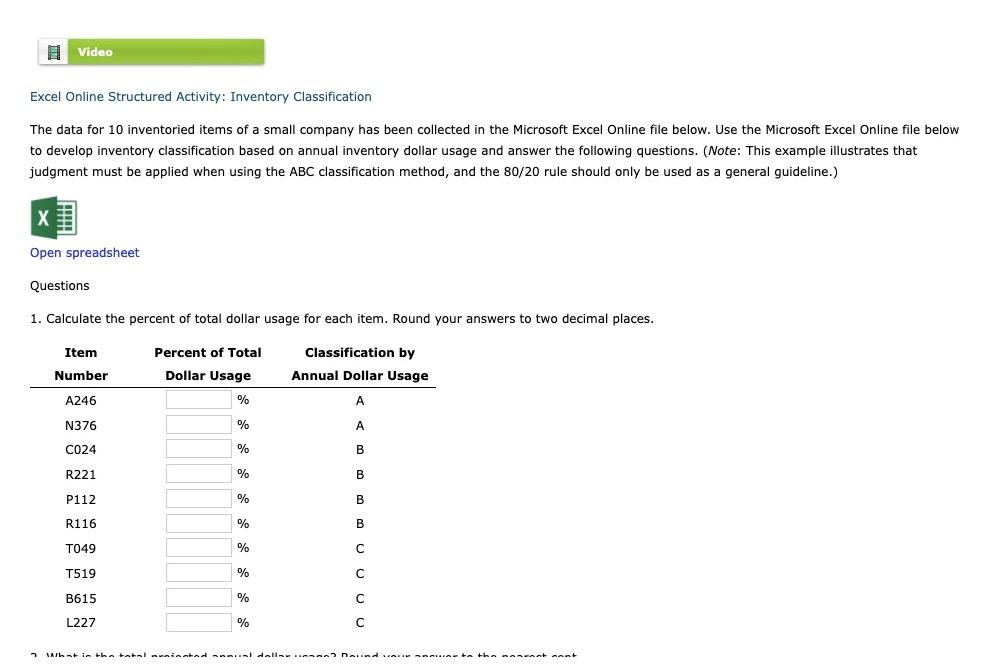
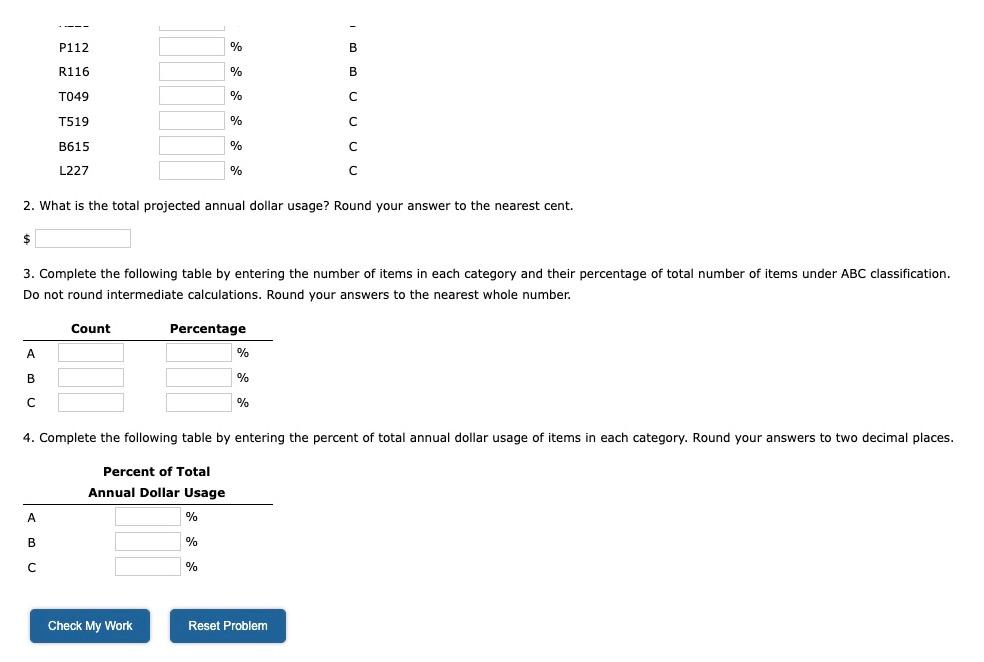
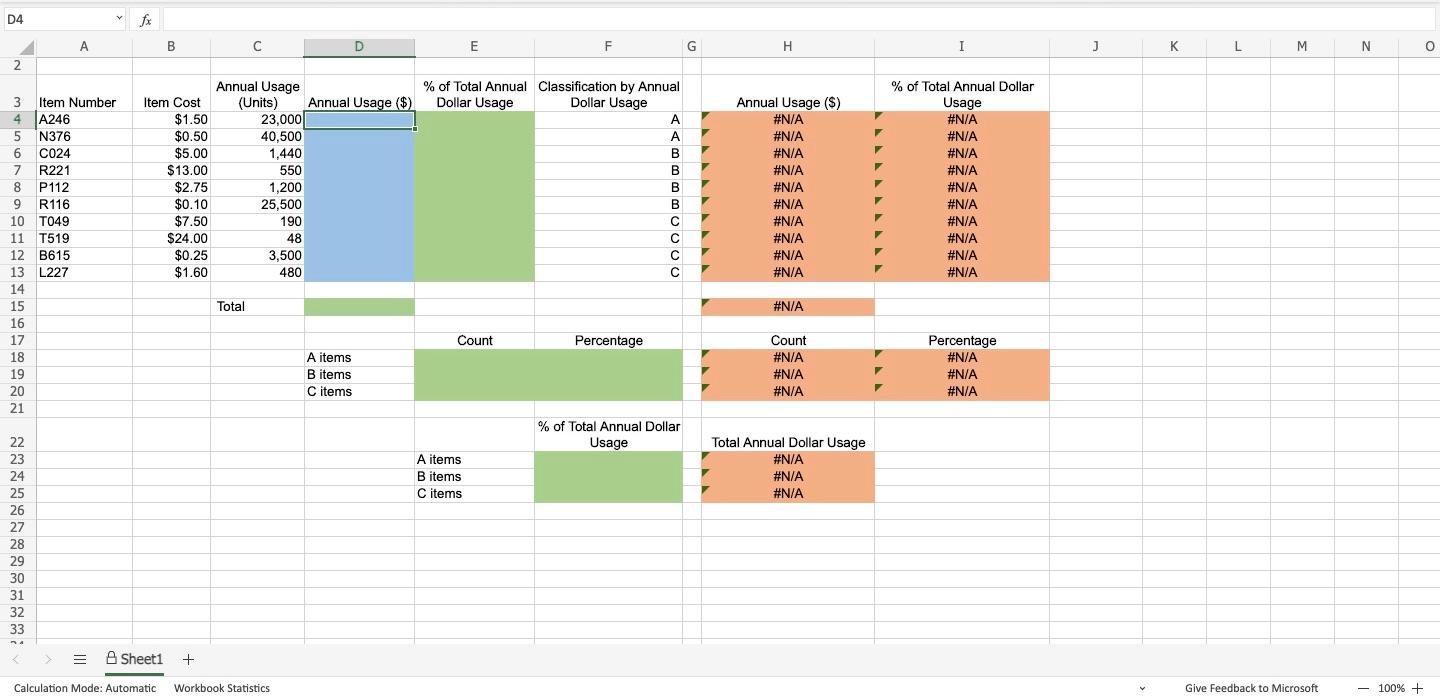
Question: Video Excel Online Structured Activity: Inventory Classification The data for 10 inventoried items of a small company has been collected in the Microsoft Excel Online

Video Excel Online Structured Activity: InventoryVideo Excel Online Structured Activity: InventoryVideo Excel Online Structured Activity: Inventory

Video Excel Online Structured Activity: Inventory Classification The data for 10 inventoried items of a small company has been collected in the Microsoft Excel Online file below. Use the Microsoft Excel Online file below to develop inventory classification based on annual inventory dollar usage and answer the following questions. (Note: This example illustrates that judgment must be applied when using the ABC classification method, and the 80/20 rule should only be used as a general guideline.) X Open spreadsheet Questions 1. Calculate the percent of total dollar usage for each item. Round your answers to two decimal places. Item Percent of Total Classification by Annual Dollar Usage Number Dollar Usage A246 % A N376 % A C024 % B R221 % B P112 % B R116 % B T049 % T519 % UUUU B615 % L227 % VAT st in the total niatad nisi dalla narrad P112 % B R116 % B T049 % T519 % C B615 % L227 % 2. What is the total projected annual dollar usage? Round your answer to the nearest cent. $ 3. Complete the following table by entering the number of items in each category and their percentage of total number of items under ABC classification. Do not round intermediate calculations. Round your answers to the nearest whole number. Count Percentage % B % % 4. Complete the following table by entering the percent of total annual dollar usage of items in each category. Round your answers to two decimal places. Percent of Total Annual Dollar Usage % B % % Check My Work Reset Problem D4 fx B D E F G H I J K L M N 0 2 Annual Usage (Units) Annual Usage ($) 23,000 3 Item Number 4 A246 5 N376 6 C024 7 R221 8 P112 9 R116 10 T049 11 T519 12 B615 13 L227 14 15 16 17 18 19 20 21 Item Cost $1.50 $0.50 $5.00 $13.00 $2.75 $0.10 $7.50 $24.00 $0.25 $1.60 % of Total Annual Classification by Annual Dollar Usage Dollar Usage A B B B B 40,500 1,440 550 1,200 25,500 190 48 3,500 480 Annual Usage ($) #N/A #N/A #N/A #N/A #N/A #N/A #N/A #N/A #N/A #N/A % of Total Annual Dollar Usage #N/A #N/A #N/A #N/A #N/A #N/A #N/A #N/A #N/A #N/A Total #N/A Count Percentage A items B items C items Count #N/A #N/A #N/A Percentage #N/A #N/A #N/A % of Total Annual Dollar Usage A items Bitems C items Total Annual Dollar Usage #N/A #N/A #N/A 22 23 24 25 26 27 28 29 30 31 32 33 . = A Sheet1 + Calculation Mode: Automatic Workbook Statistics Give Feedback to Microsoft - 100% +

Step by Step Solution

There are 3 Steps involved in it

1 Expert Approved Answer
Step: 1 Unlock blur-text-image
Question Has Been Solved by an Expert!

Get step-by-step solutions from verified subject matter experts

Step: 2 Unlock
Step: 3 Unlock

Students Have Also Explored These Related General Management Questions!