

Question: View Policies Current Attempt in Progress Condensed balance sheet and income statement data for Jergan Corporation are presented here. Jergan Corporation Balance Sheets December 31
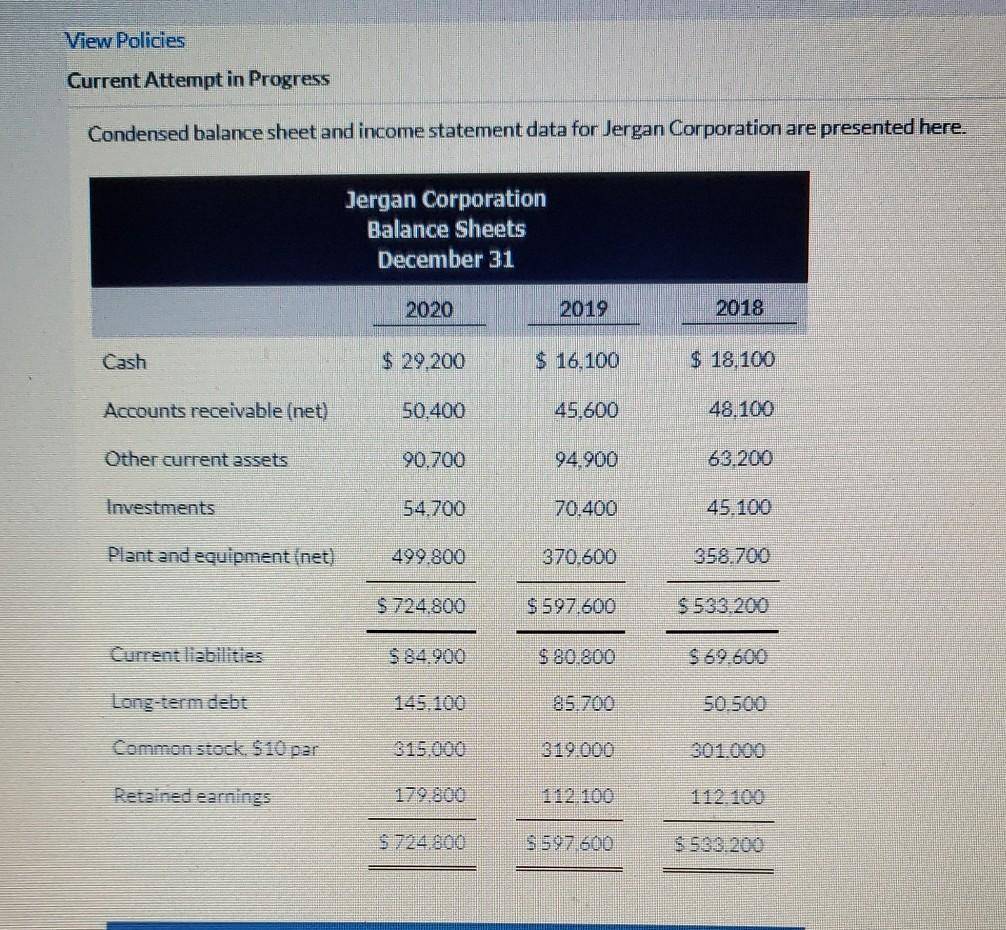
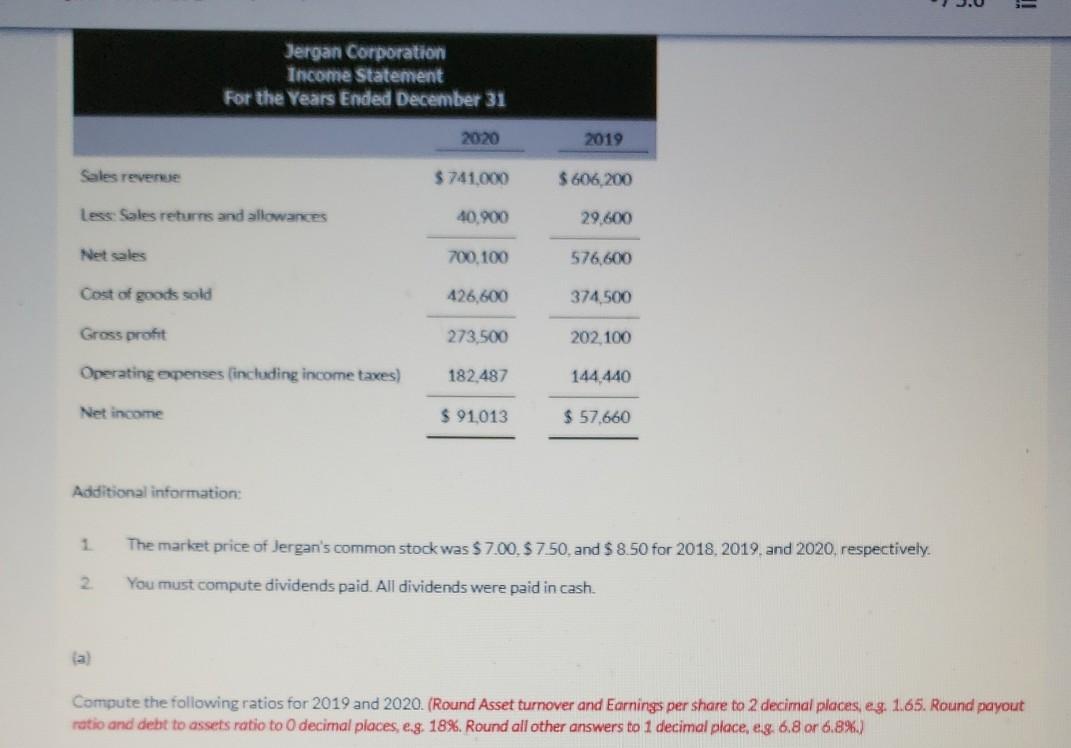
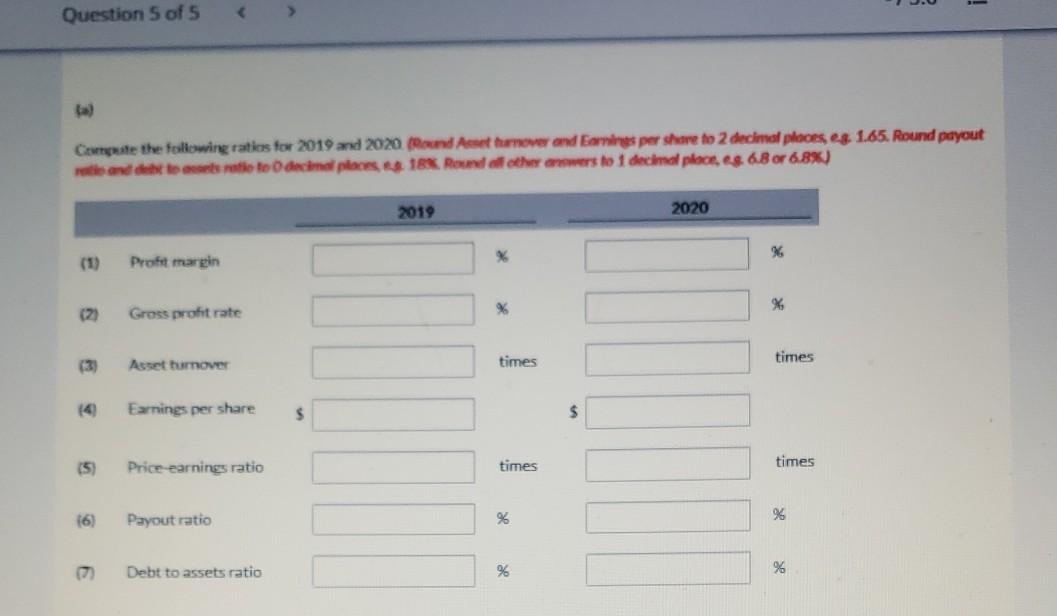
View Policies Current Attempt in Progress Condensed balance sheet and income statement data for Jergan Corporation are presented here. Jergan Corporation Balance Sheets December 31 2020 2019 2018 Cash $ 29,200 $ 16.100 $ 18,100 Accounts receivable (net) 50.400 45,600 48.100 Other current assets 90.700 94.900 63.200 Investments 54700 70.400 45.100 Plant and equipment (net) 499.800 370.600 358.700 $ 724.800 $ 597.600 $ 533.200 Current liebilities $ 84.900 $ 80.800 $ 69.600 Long-term debt 145.100 85.700 50 500 Common stock. $10 par 315.000 319.000 301.000 Retained earnings 112.100 112. 100 $724 800 $ 597 600 $ 593.200 Jergan Corporation Income Statement For the Years Ended December 31 2020 2019 Sales revenue $741.000 $ 606,200 Less Sales returns and allowances 40.900 29.600 Net sales 700.100 576,600 Cost of goods sold 426,600 374,500 Gross profit 273,500 202,100 Operating epenses (including income taxes) 182.487 144 440 Net income $ 91.013 $ 57,660 Additional information: 1 The market price of Jergan's common stock was $7.00, $7.50 and $ 8.50 for 2018, 2019 and 2020, respectively. You must compute dividends paid. All dividends were paid in cash Compute the following ratios for 2019 and 2020. (Round Asset turnover and Earnings per share to 2 decimal places, eg. 1.65. Round payout ratio and debt to assets ratio to 0 decimal places, e.g. 18%. Round all other answers to 1 decimal place, e.g. 6.8 or 6.8%.) Question 5 of 5 Compute the following rates for 2019 and 2020 Round Asset herover and Earnings per shave to 2 decimal plooses. 1.65. Round payout and tomato to decimal places 1. Round of the answers to decimal place, s. 6.8 or 6.8%) 2019 2020 Profit margin (2) % Gross profit rate % times times Asset turnover 14 Earnings per share $ $ (5) Price earnings ratio times times 16) Payout ratio % %6 171 Debt to assets ratio % %
Step by Step Solution
There are 3 Steps involved in it

Get step-by-step solutions from verified subject matter experts