

Question: View Policies Current Attempt in Progress Condensed data from the comparative statement of financial position of Granger Inc. follow: 2021 2020 2019 Current assets $114,000
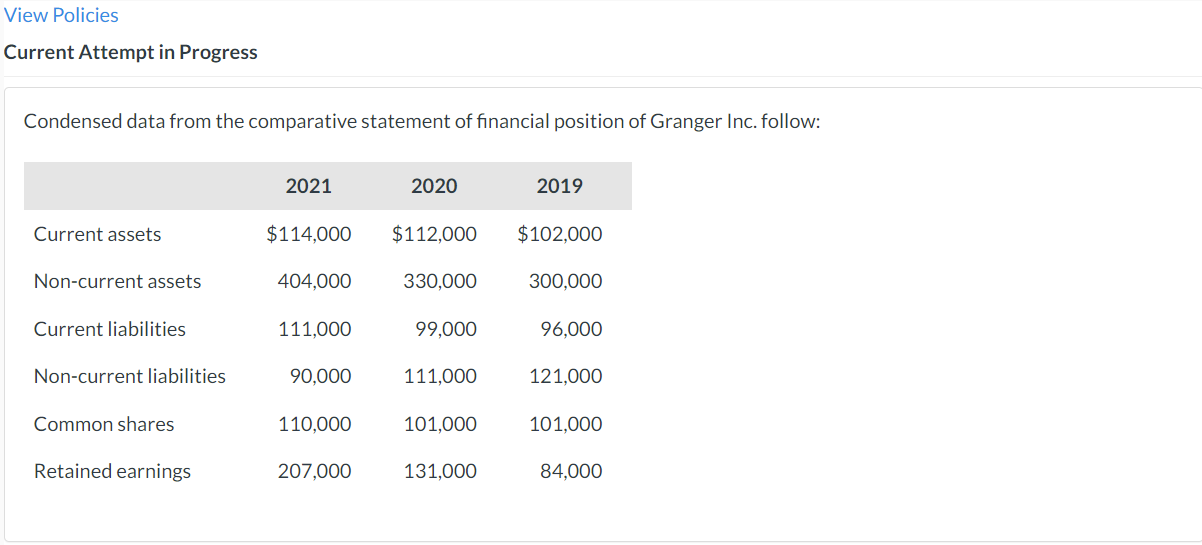
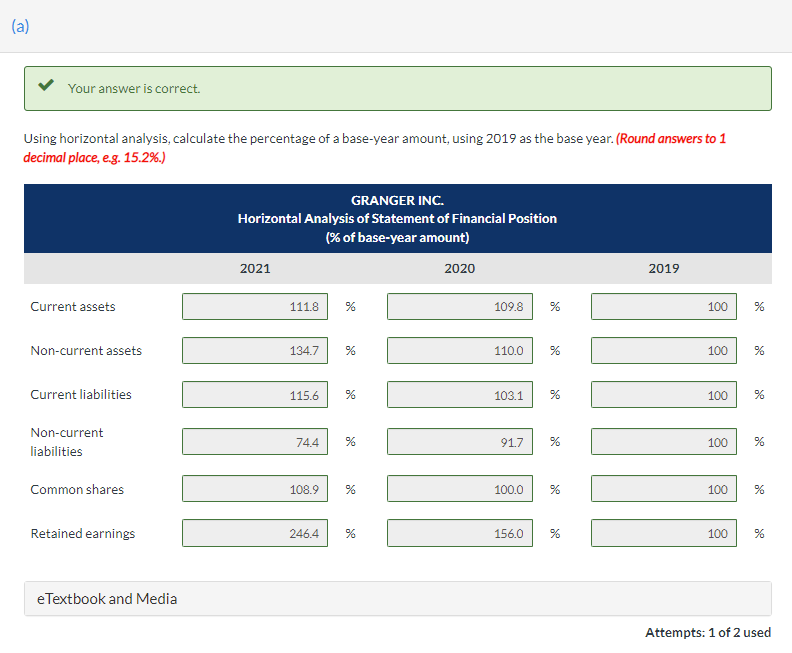
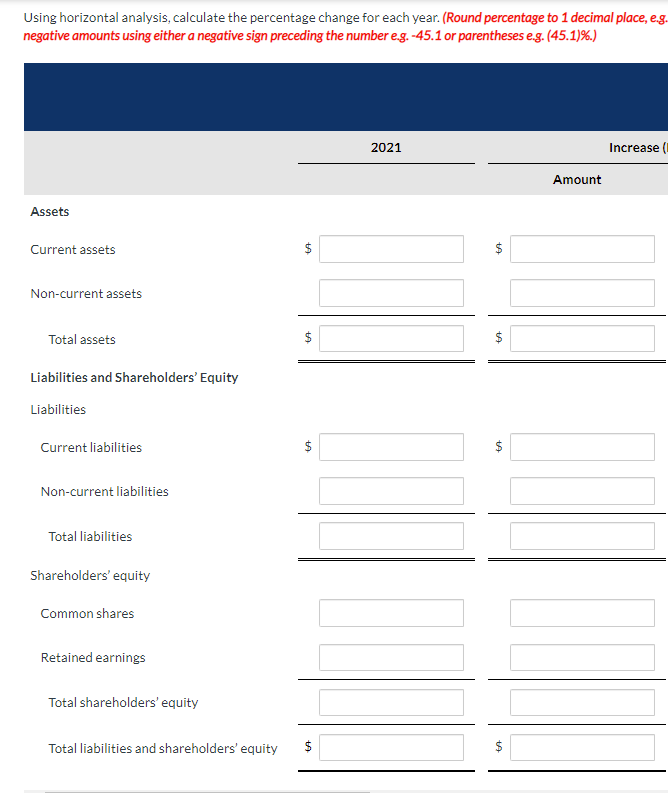
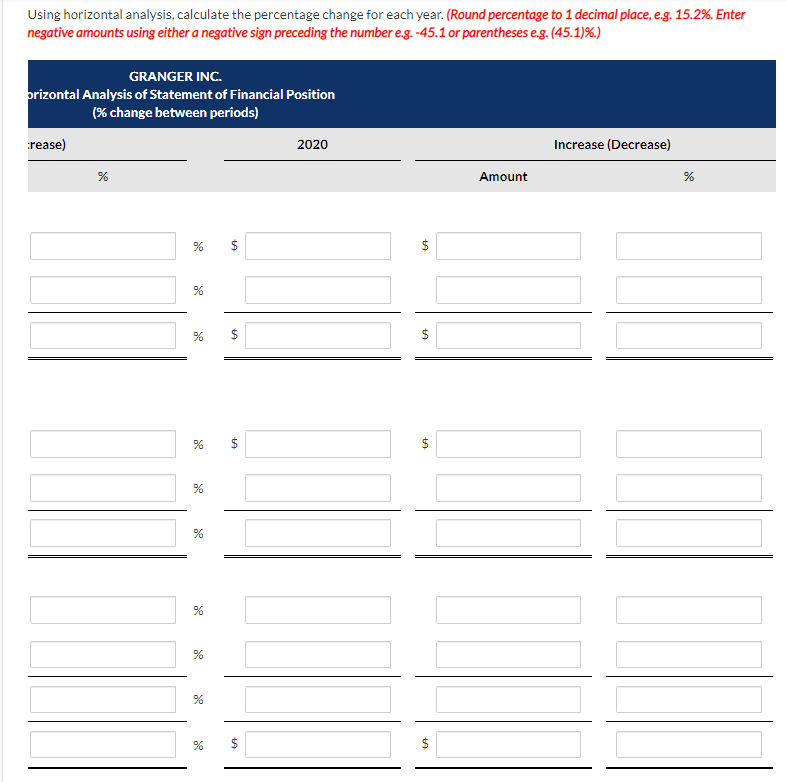
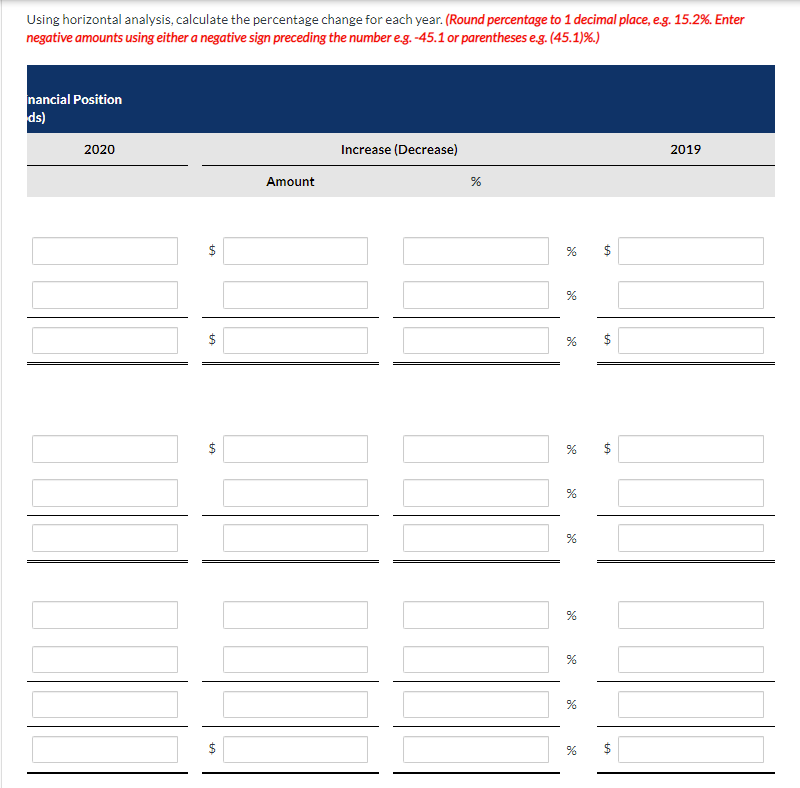
View Policies Current Attempt in Progress Condensed data from the comparative statement of financial position of Granger Inc. follow: 2021 2020 2019 Current assets $114,000 $112,000 $102,000 Non-current assets 404,000 330,000 300,000 Current liabilities 111,000 99,000 96,000 Non-current liabilities 90,000 111,000 121,000 Common shares 110,000 101,000 101,000 Retained earnings 207,000 131,000 84,000 (a) Your answer is correct. Using horizontal analysis, calculate the percentage of a base-year amount, using 2019 as the base year. (Round answers to 1 decimal place, e.g. 15.2%.) GRANGER INC. Horizontal Analysis of Statement of Financial Position (% of base-year amount) 2021 2020 2019 Current assets 111.8 % 109.8 % 100 % Non-current assets 134.7 % 110.0 100 % Current liabilities 115.6 % 103.1 % 100 % Non-current liabilities 74.4 % 91.7 % 100 % Common shares 108.9 % 100.0 % 100 % Retained earnings 246.4 % 156.0 100 % e Textbook and Media Attempts: 1 of 2 used Using horizontal analysis, calculate the percentage change for each year. (Round percentage to 1 decimal place, e.g. negative amounts using either a negative sign preceding the number e.g. -45.1 or parentheses e.g. (45.1)%.) 2021 Increase Amount Assets Current assets $ $ Non-current assets Total assets $ $ Liabilities and Shareholders' Equity Liabilities Current liabilities $ $ $ $ Non-current liabilities Total liabilities Shareholders' equity Common shares Retained earnings Total shareholders' equity Total liabilities and shareholders' equity $ $ $ Using horizontal analysis, calculate the percentage change for each year. (Round percentage to 1 decimal place, e.g. 15.2%. Enter negative amounts using either a negative sign preceding the number e.g.-45.1 or parentheses e.g. (45.1)%.) GRANGER INC. brizontal Analysis of Statement of Financial Position (% change between periods) rease) 2020 Increase (Decrease) % Amount % % $ $ % % $ $ $ % $ $ % % % % % % $ $ Using horizontal analysis, calculate the percentage change for each year. (Round percentage to 1 decimal place, e.g. 15.2%. Enter negative amounts using either a negative sign preceding the number eg.-45.1 or parentheses eg. (45.1)%.) nancial Position ds) 2020 Increase (Decrease) 2019 Amount % % $ % $ % $ $ % $ % % % % % $ % $
Step by Step Solution
There are 3 Steps involved in it

Get step-by-step solutions from verified subject matter experts