

Question: View Policies Current Attempt in Progress Following is a random sample of 15 measurements from high-flow rivers and 13 from low-flow rivers of a total
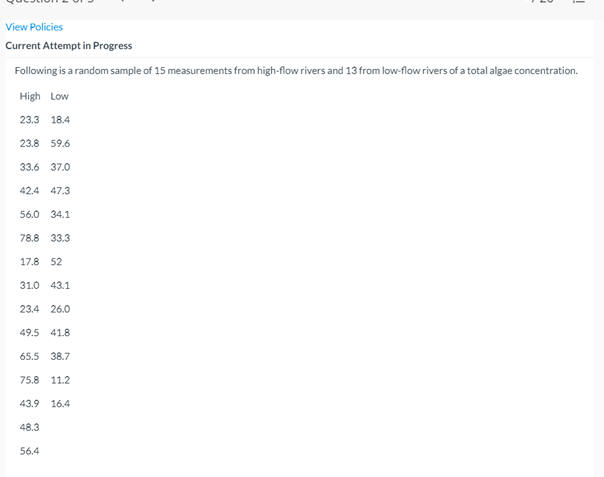
View Policies Current Attempt in Progress Following is a random sample of 15 measurements from high-flow rivers and 13 from low-flow rivers of a total algae concentration. High Low 23.3 18.4 23.8 59.6 33.6 37.0 42.4 47.3 56.0 34.1 78.8 33.3 17.8 52 310 43.1 23.4 26.0 49.5 41 8 65.5 38.7 75.8 11.2 43.9 16.4 48.3 56.430.4 Is there evidence to suggest that the sta ndard deviations of the aglae concentration in the two types of rivers differ? Use a = 0.05. Round your answers to two decimal places {e.g. 93.76). Rejectthenullhypothesisif a What is the test statistic? Round your answer to two decimal places {e.g. 98.76). fo = Save for Later Attempts: 0 of 2 used
Step by Step Solution
There are 3 Steps involved in it

Get step-by-step solutions from verified subject matter experts