

Question: View the raw data table given in this study.You do not have to analyses the raw data.The raw data is only given to you so
View the raw data table given in this study.You do not have to analyses the raw data.The raw data is only given to you so that you can understand the methodology more clearly, View the SPSS data analysis for this study.This is the information you will need to write the results of this study, include a graph of the results.
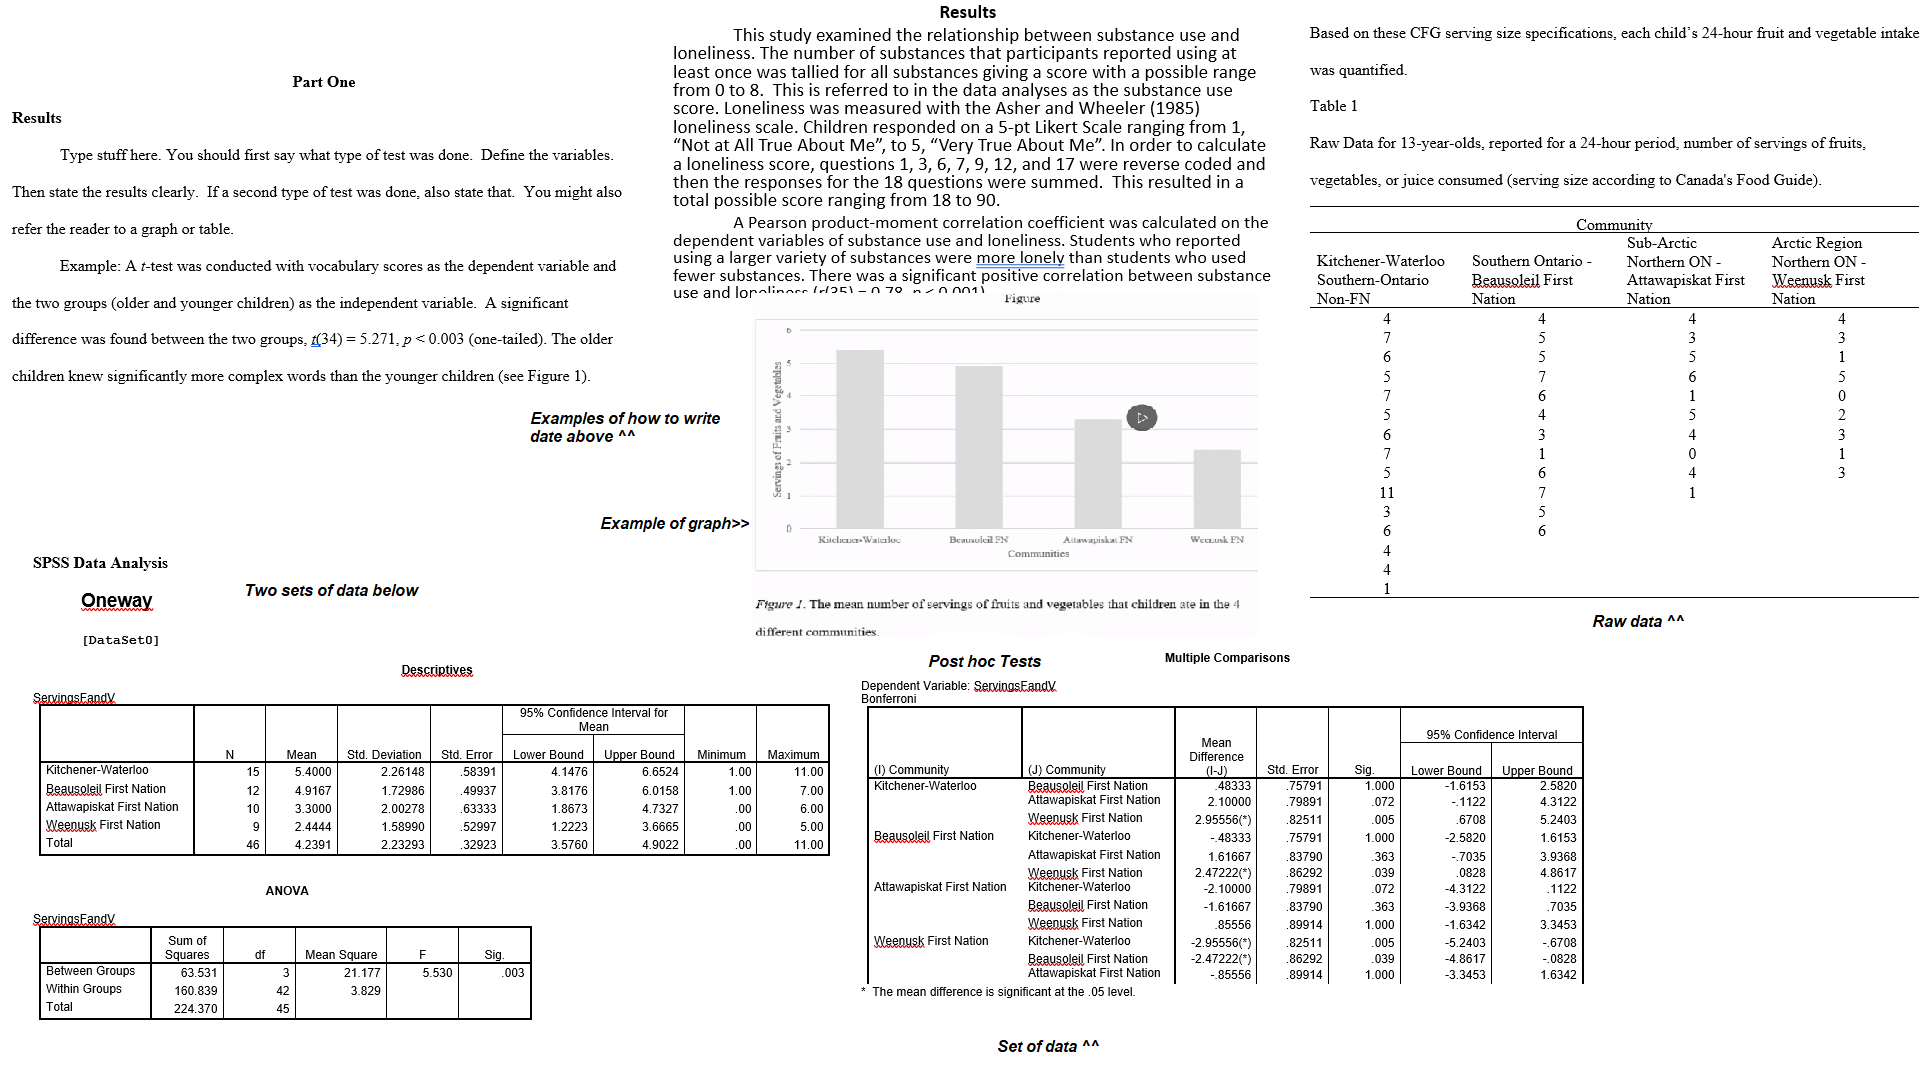
Results This study examined the relationship between substance use and Based on these CFG serving size specifications, each child's 24-hour fruit and vegetable intake loneliness. The number of substances that participants reported using at Part One least once was tallied for all substances giving a score with a possible range was quantified. from 0 to 8. This is referred to in the data analyses as the substance use Results score. Loneliness was measured with the Asher and Wheeler (1985) Table 1 loneliness scale. Children responded on a 5-pt Likert Scale ranging from 1, Type stuff here. You should first say what type of test was done. Define the variables. "Not at All True About Me", to 5, "Very True About Me". In order to calculate Raw Data for 13-year-olds, reported for a 24-hour period, number of servings of fruits, a loneliness score, questions 1, 3, 6, 7, 9, 12, and 17 were reverse coded and Then state the results clearly. If a second type of test was done, also state that. You might also then the responses for the 18 questions were summed. This resulted in a vegetables, or juice consumed (serving size according to Canada's Food Guide). total possible score ranging from 18 to 90. refer the reader to a graph or table. A Pearson product-moment correlation coefficient was calculated on the dependent variables of substance use and loneliness. Students who reported Community Example: A t-test was conducted with vocabulary scores as the dependent variable and using a larger variety of substances were more lonely than students who used Sub-Arctic Arctic Region fewer substances. There was a significant positive correlation between substance Kitchener-Waterloo Southern Ontario - Northern ON - Northern ON - use and loralinger /251 -n 70 mannn1i Southern-Ontario Beausoleil First Attawapiskat First Weenusk First the two groups (older and younger children) as the independent variable. A significant Figure Non-FN Nation Nation Nation difference was found between the two groups, [(34) = 3.271, p > Beausoleil FN Allawayiska( FN WecLusk FN SPSS Data Analysis Communities Oneway Two sets of data below Figure /. The mean number of servings of fruits and vegetables that children ate in the 4 Raw data ^ ^ [DataSet0] different communities Post hoc Tests Multiple Comparisons Descriptives Dependent Variable: ServingsFandy ServingsFandy Bonferroni 95% Confidence Interval for Mean 95% Confidence Interval Mean Std. Deviation Std. Error Lower Bound Upper Bound Mean Minimum Maximum Kitchener-Waterloo Difference 5.400 2.2614 58391 4.1476 6.6524 1.0 11.00 (1) Community (J) Community (1 - J ) Std. Error sig. Lower Bound Upper Bound Beausoleil First Nation 4.916 1.72986 .49937 3.8176 6.0158 1.0 7.00 Kitchener-Waterloo Beausoleil First Nation 48333 .75791 1.000 1.6153 2.5820 Attawapiskat First Nation 3.3000 2.00278 6333 1.8673 4.7327 0 6.00 Attawapiskat First Nation 2.10000 9891 .072 -.1122 4.3122 Weenusk First Nation 2.4444 1.58990 52997 1.2223 3.6665 00 5.00 Meenusk First Nation 2.95556(*) 8251 .005 .6708 5.240 Total 4.2391 2.2329 .32923 3.5760 4.9022 00 11.00 Beausoleil First Nation Kitchener-Waterloo 48333 .75791 1.000 2.5820 1.6153 Attawapiskat First Nation 1.6166 8379 .363 7035 3.9368 Meenusk First Nation 2.47222(*) 86292 039 .0828 4.8617 ANOVA Attawapiskat First Nation Kitchener-Waterloo -2. 1000 .79891 072 -4.3122 .1122 Beausoleil First Nation 1.61667 83790 .363 3.9368 .7035 Servingstandy Weenusk First Nation .85556 8991 1.000 1.6342 3.3453 Sum of Squares df Mean Square sig. Weenusk First Nation Kitchener-Waterloo -2.95556(*) 82511 005 -5.2403 -.6708 Beausoleil First Nation 2.47222(*) 86292 .039 -4.8617 .0828 Between Groups $3.531 21.177 5.530 003 Attawapiskat First Nation -.85556 89914 1.000 -3.3453 1.6342 Within Groups 160.839 3.829 * The mean difference is significant at the .05 level. Total 224.370 Set of data ^ ^
Step by Step Solution
There are 3 Steps involved in it

Get step-by-step solutions from verified subject matter experts