

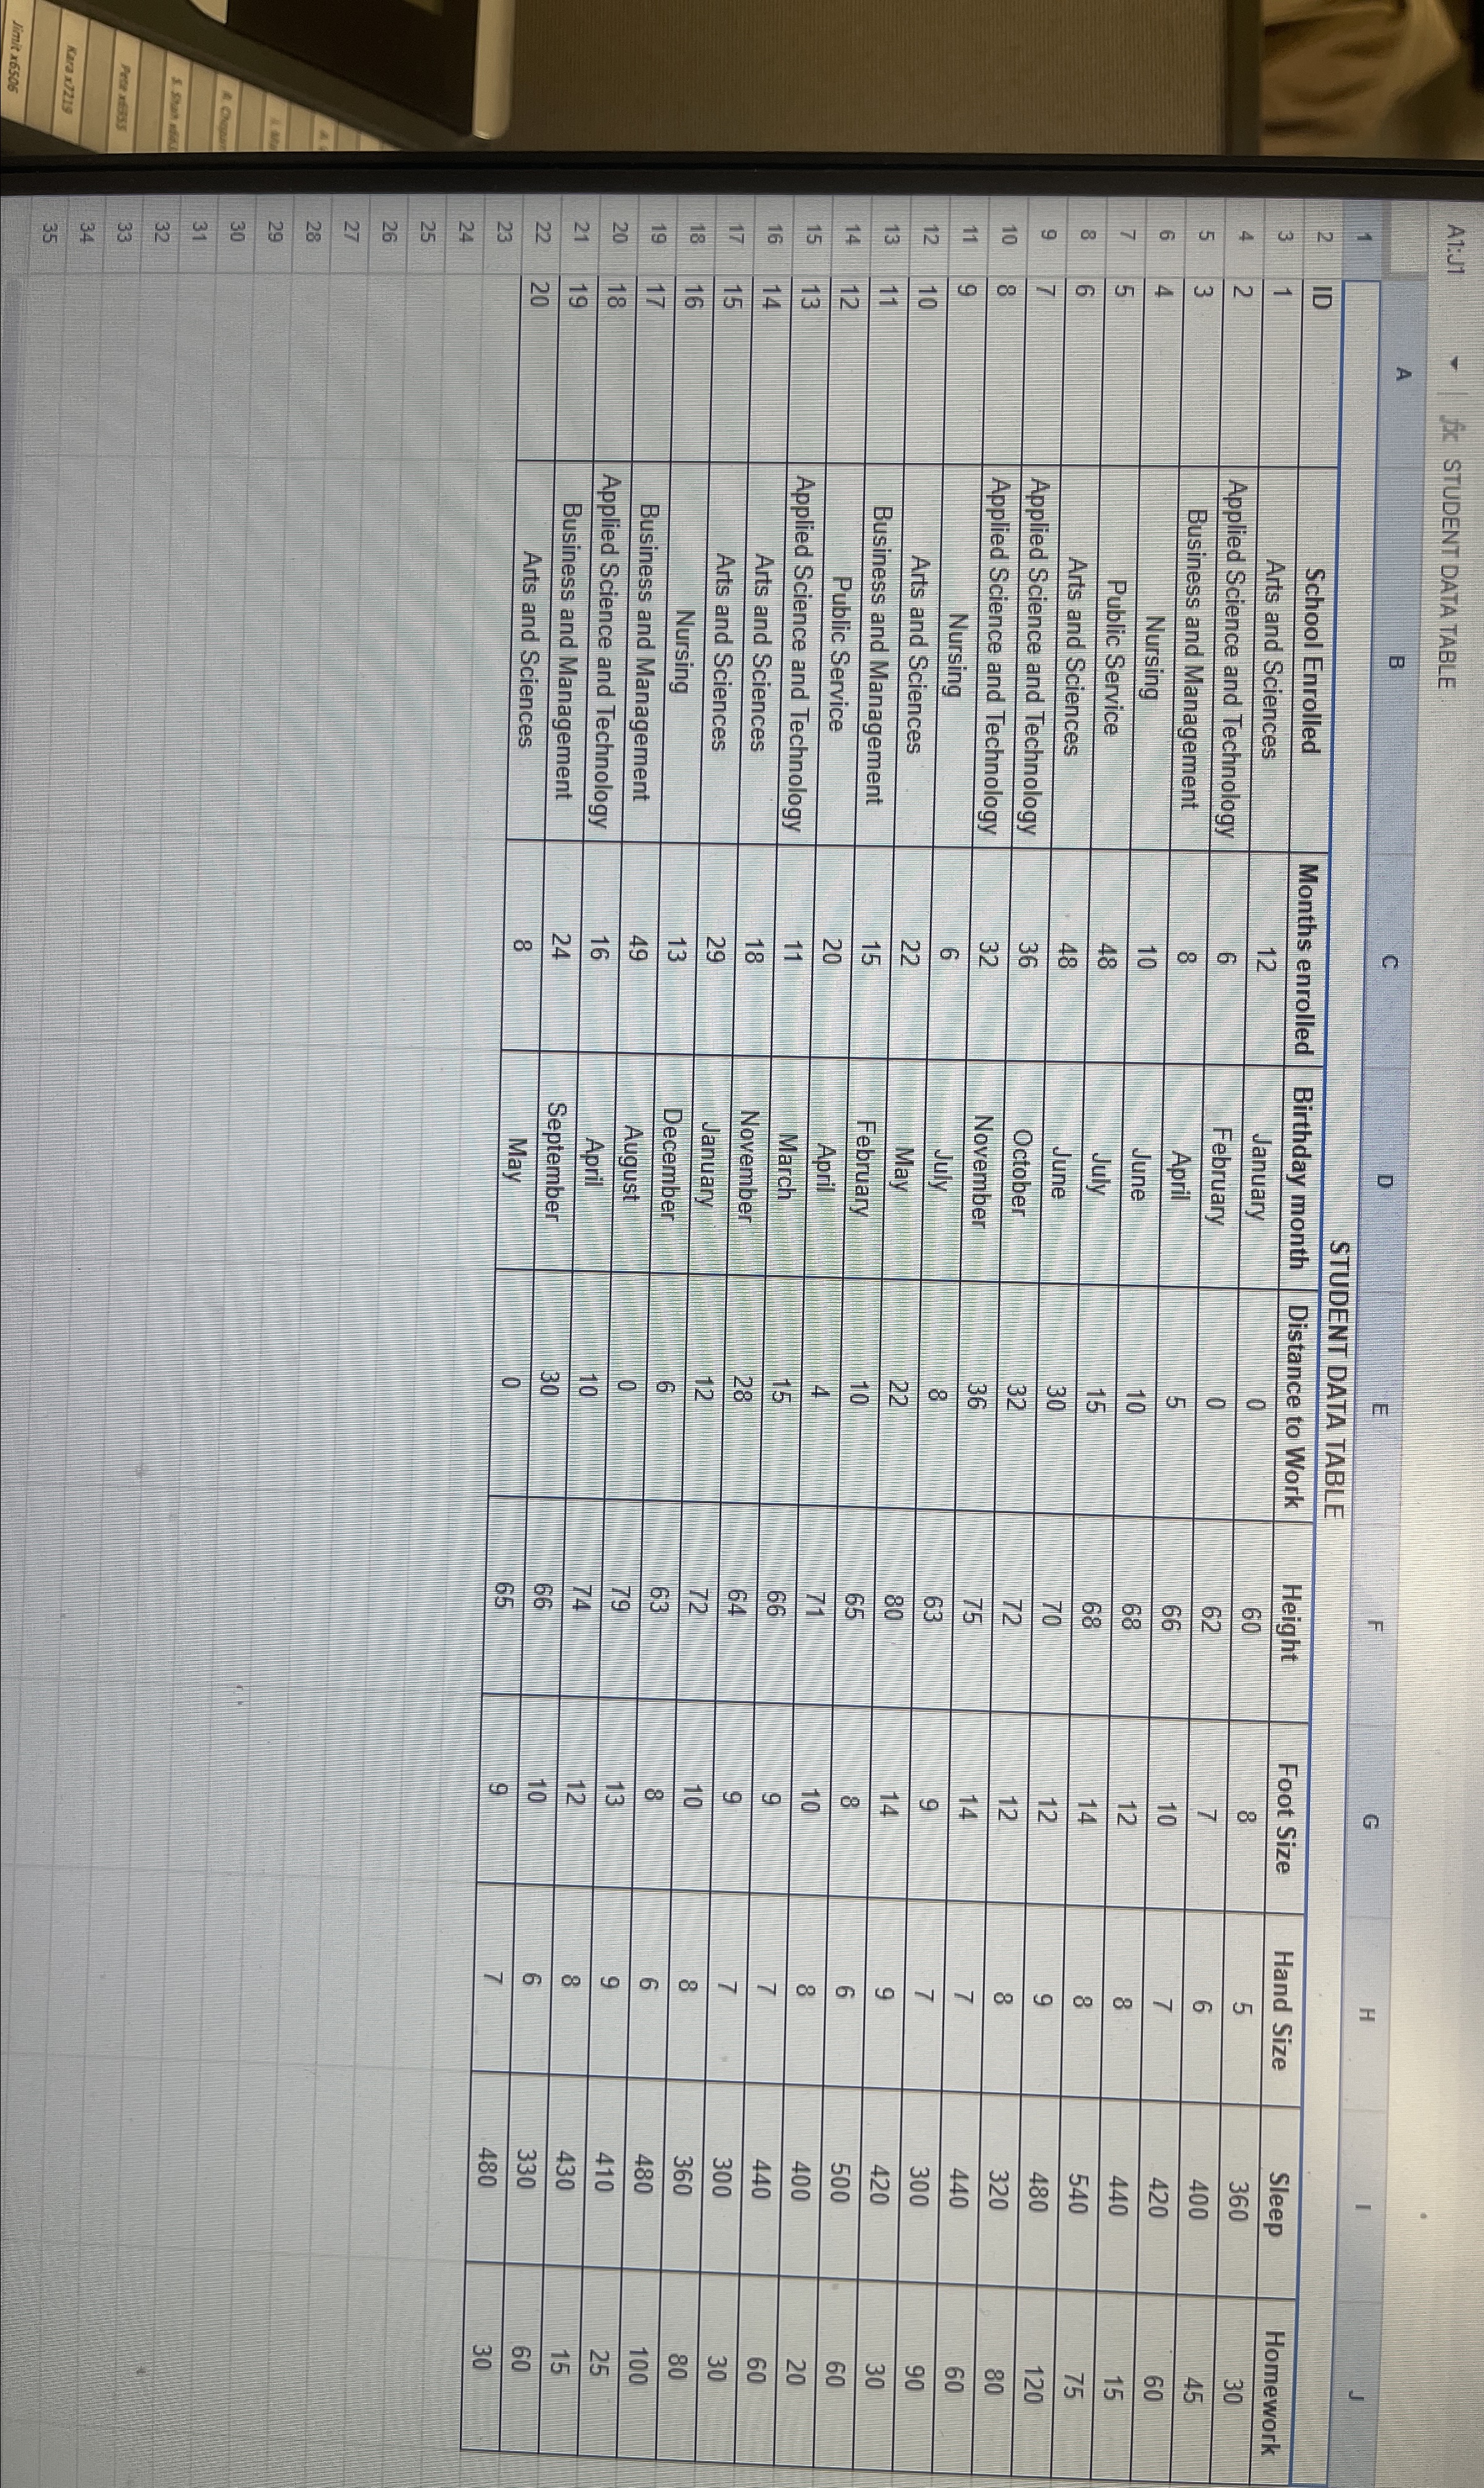
Question: View the variable Months Enrolled in the Student Data Table and create a histogram, stem and leaf plot, and box plot of the data. Calculate
View the variable Months Enrolled in the Student Data Table and create a histogram, stem and leaf plot, and box plot of the data. Calculate the mean, median, and sample standard deviation and number summary Min Q Q Q Max and describe what the data mean.
Step by Step Solution
There are 3 Steps involved in it
1 Expert Approved Answer
Step: 1 Unlock

Question Has Been Solved by an Expert!
Get step-by-step solutions from verified subject matter experts
Step: 2 Unlock
Step: 3 Unlock