

Question: View the variable Months Enrolled in the Student Data Table and create a histogram, stem and leaf plot, and box plot of the data. Calculate
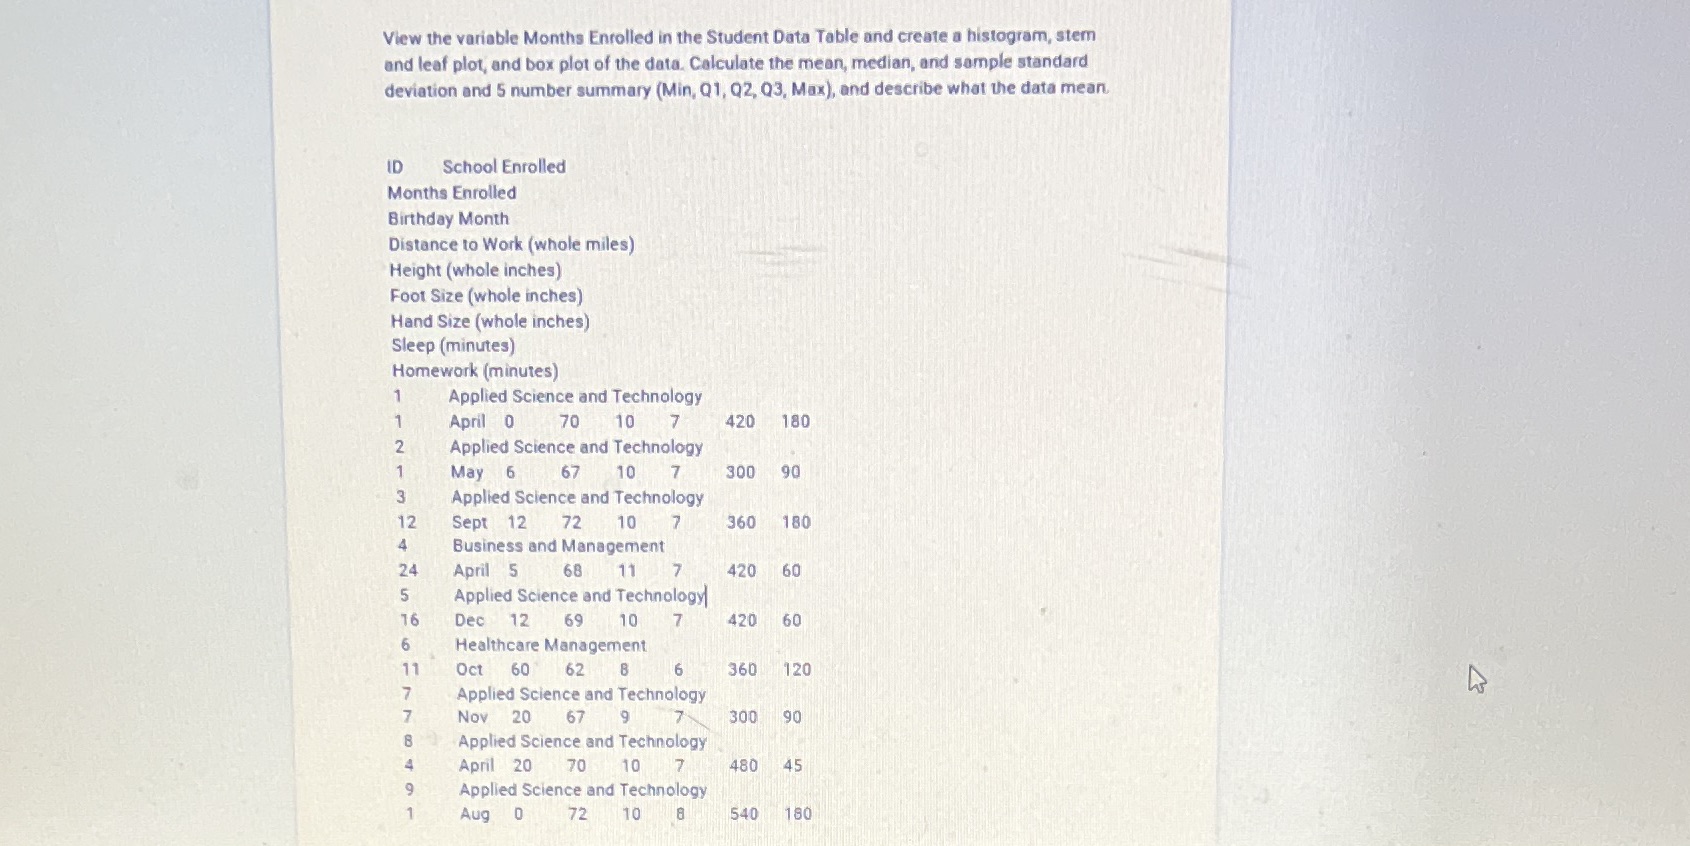
View the variable Months Enrolled in the Student Data Table and create a histogram, stem and leaf plot, and box plot of the data. Calculate the mean, median, and sample standard deviation and 5 number summary (Min, Q1, Q2, Q3. Max), and describe what the data mean. ID School Enrolled Months Enrolled Birthday Month Distance to Work (whole miles) Height (whole inches) Foot Size (whole inches) Hand Size (whole inches) Sleep (minutes) Homework (minutes) 1 Applied Science and Technology April 0 70 10 7 420 180 N - Applied Science and Technology May 6 67 10 7 300 90 w - Applied Science and Technology 12 Sept 12 72 210 7 360 180 4 Business and Management 24 April 5 68 11 7 420 60 5 Applied Science and Technology 16 Dec 12 69 10 7 420 60 6 Healthcare Management 11 Oct 60 62 B 6 360 120 Applied Science and Technology Nov 20 67 9 300 90 Applied Science and Technology April 20 70 10 7 480 45 Applied Science and Technology Aug 0 72 10 8 540 180
Step by Step Solution
There are 3 Steps involved in it

Get step-by-step solutions from verified subject matter experts