

Question: ) View Tools Help 3. Assume we want to compare the prison population (inmate sample) to the general population (national sample) in terms of IQ.
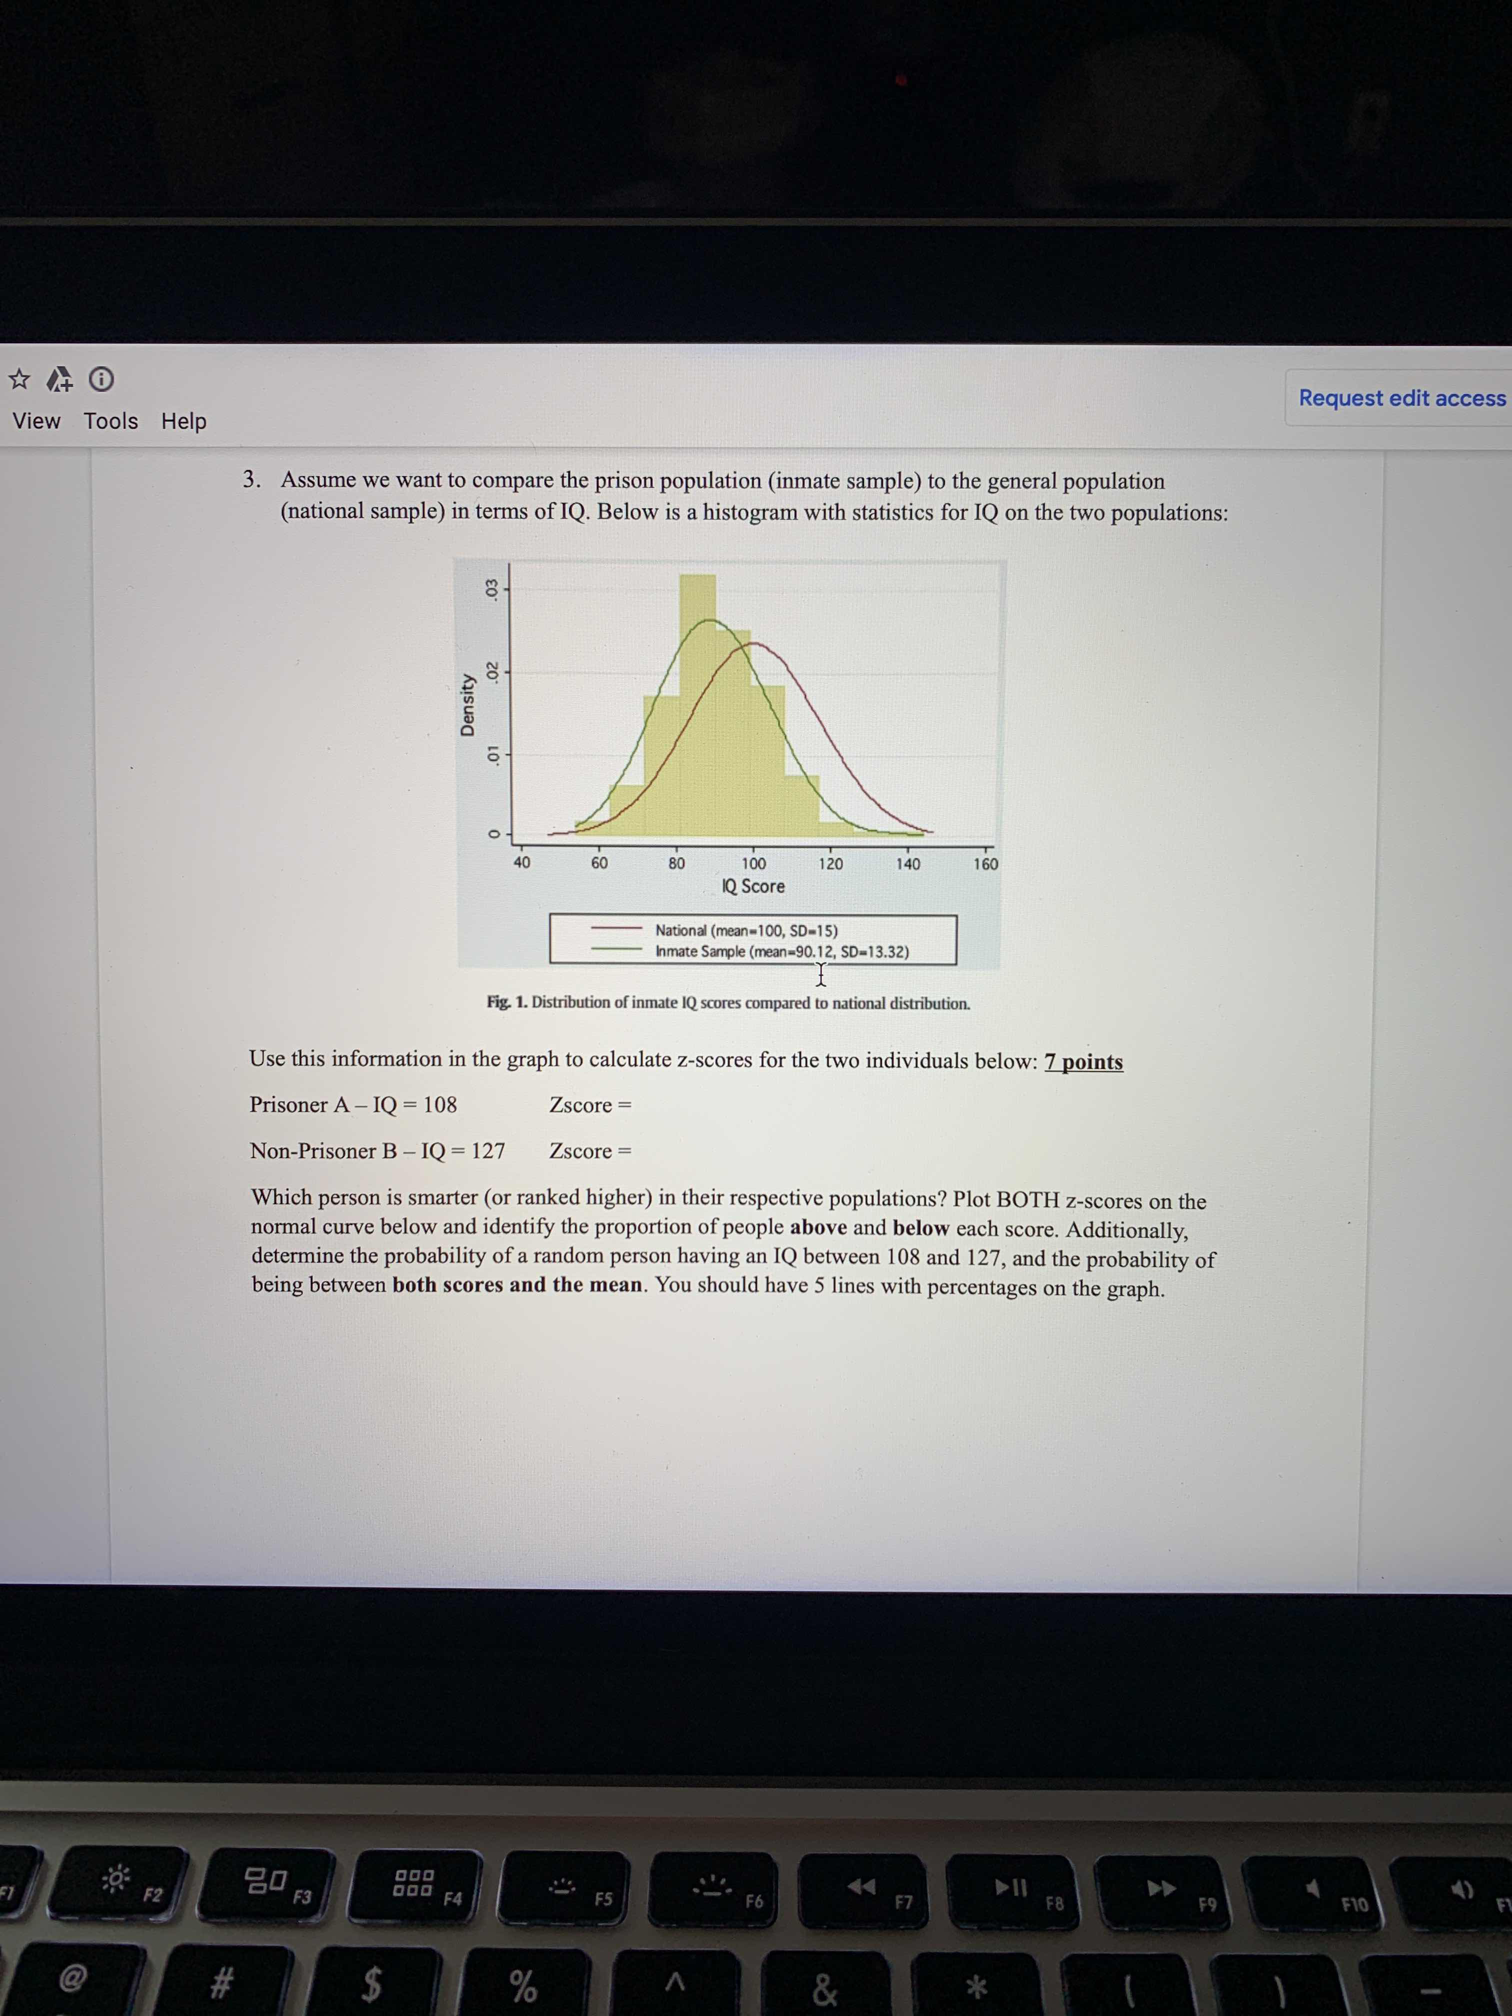
) View Tools Help 3. Assume we want to compare the prison population (inmate sample) to the general population (national sample) in terms of IQ. Below is a histogram with statistics for IQ on the two populations: (9 Q E '65 VI 5 n 5. O so so so too 120 I40 :60 IQSoore National (nun-100. 50-15] hmate Sample (neat-50.12, SD-I3.32) I Fig. I. Distribution of inmate IQ scores compared to national distribution. Use this information in the graph to calculate zscores for the two individuals below: 7 points Prisoner A w IQ = 108 Zscore = Non-Prisoner B IQ = 127 Zscore = Which person is smarter (or ranked higher) in their respective populations? Plot BOTH z-scores on the normal curve below and identify the proportion of people above and below each score. Additionally, determine the probability of a random person having an IQ between 108 and 127, and the probability of being between both scores and the mean. You should have 5 lines with percentages on the graph. ' Request edit access ""_'-m
Step by Step Solution
There are 3 Steps involved in it

Get step-by-step solutions from verified subject matter experts