

Question: The figure below shows the time diagram of a Positive Edge Triggered D Flip Flop. Choose the correct values of the output Q at
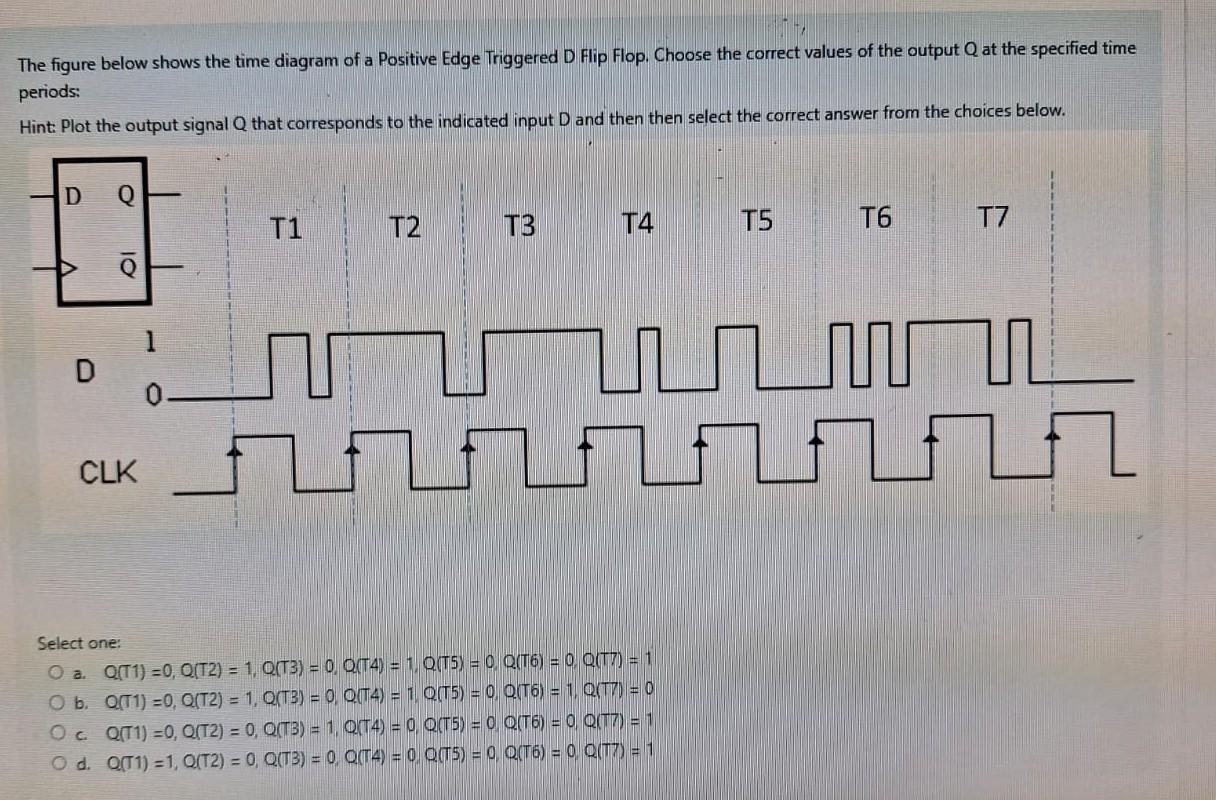
The figure below shows the time diagram of a Positive Edge Triggered D Flip Flop. Choose the correct values of the output Q at the specified time periods: Hint: Plot the output signal Q that corresponds to the indicated input D and then then select the correct answer from the choices below. D Q [] D 10 CLK 1 0 T2 1 T4 T5 Select one: O a. Q(T1)=0, Q(T2) = 1, Q(T3) = 0, Q(T4) = 1, Q(T5) = 0, Q(T6) = 0, Q(T7) = 1 O b. Q(T1) =0, Q(T2) = 1, Q(TB) = 0, Q(T4) = 1, Q(T5) = 0, Q(T6) = 1, Q(T7) = 0 Oc QT1) =0, Q(T2) = 0, Q(TB) = 1, QT4) = 0, Q(T5) = 0 Q(T6) = 0, Q(T7) = 1 O d. Q(T1) =1, Q(T2) = 0, Q(TB) = 0, Q(T4) = 0 Q(T5) = 0, Q(T6) = 0, Q(T7) = 1 T6 www T7
Step by Step Solution
There are 3 Steps involved in it
The detailed answer for the above question is provided below Explanation A D flipflop is a sequentia... View full answer

Get step-by-step solutions from verified subject matter experts