

Question: w Lab 2 participation exercise (2) - Saved to my Mac References Mailings Review View Tell me Page 7 One of the most commonly used
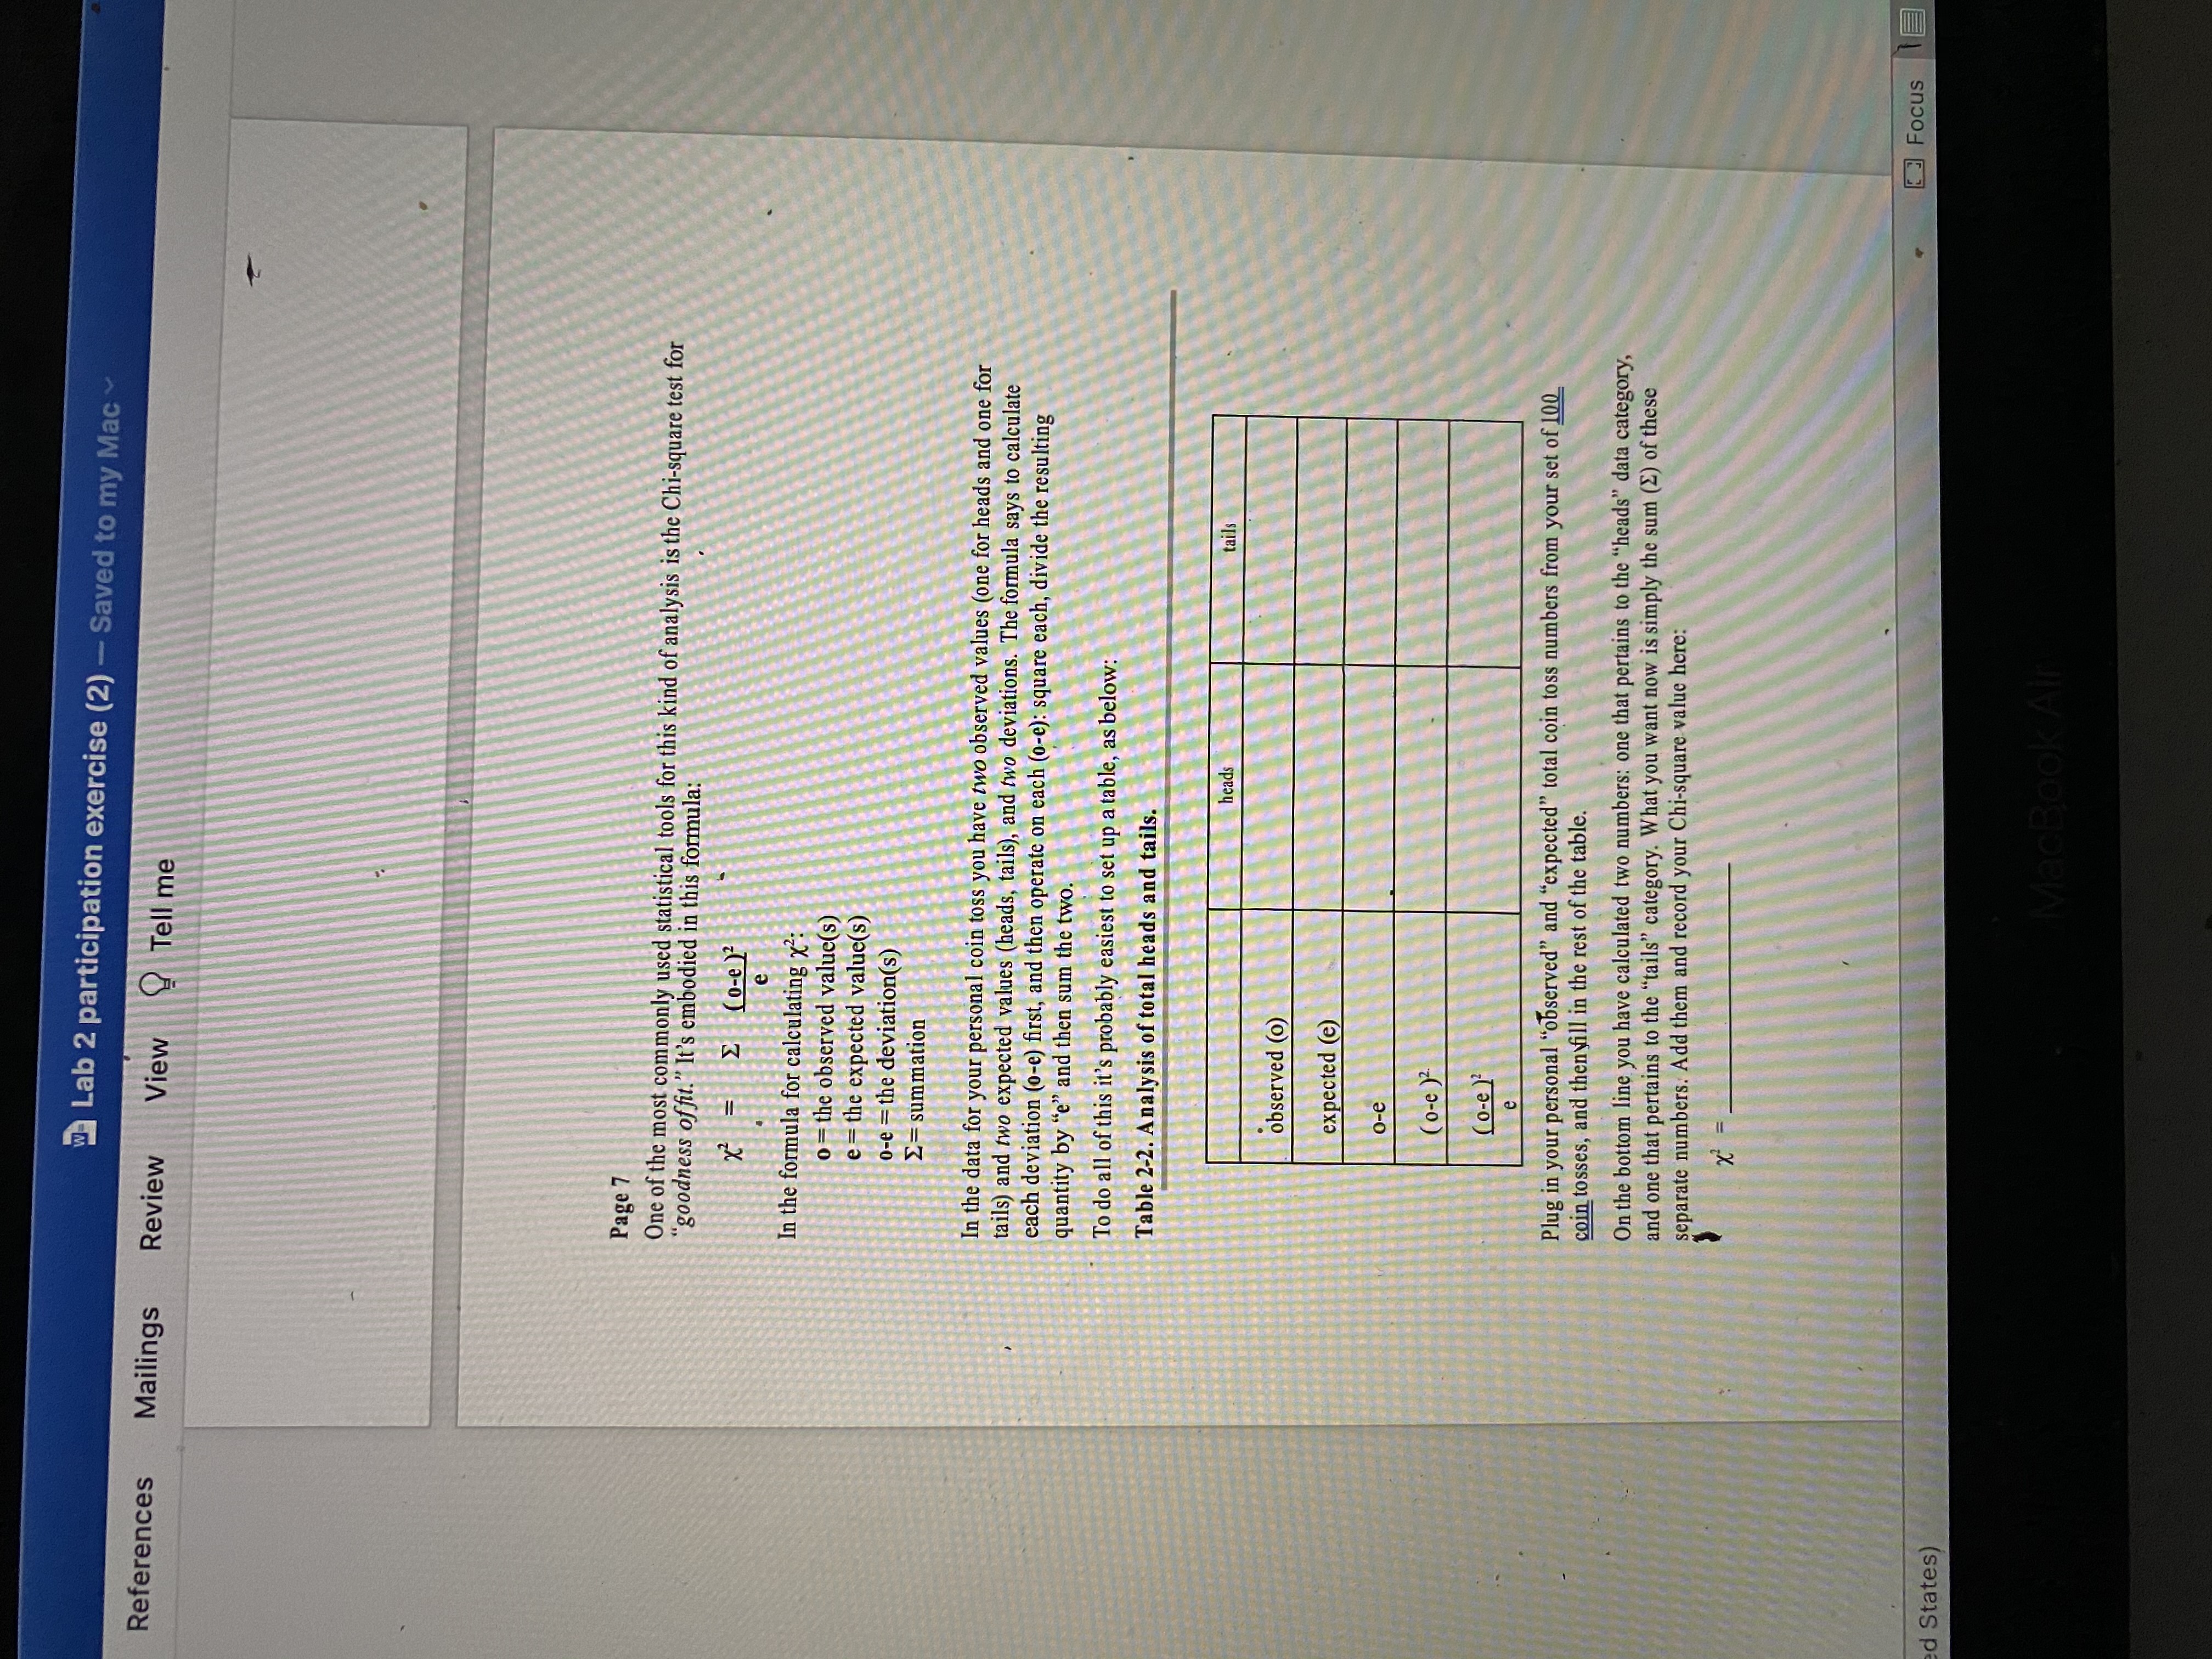
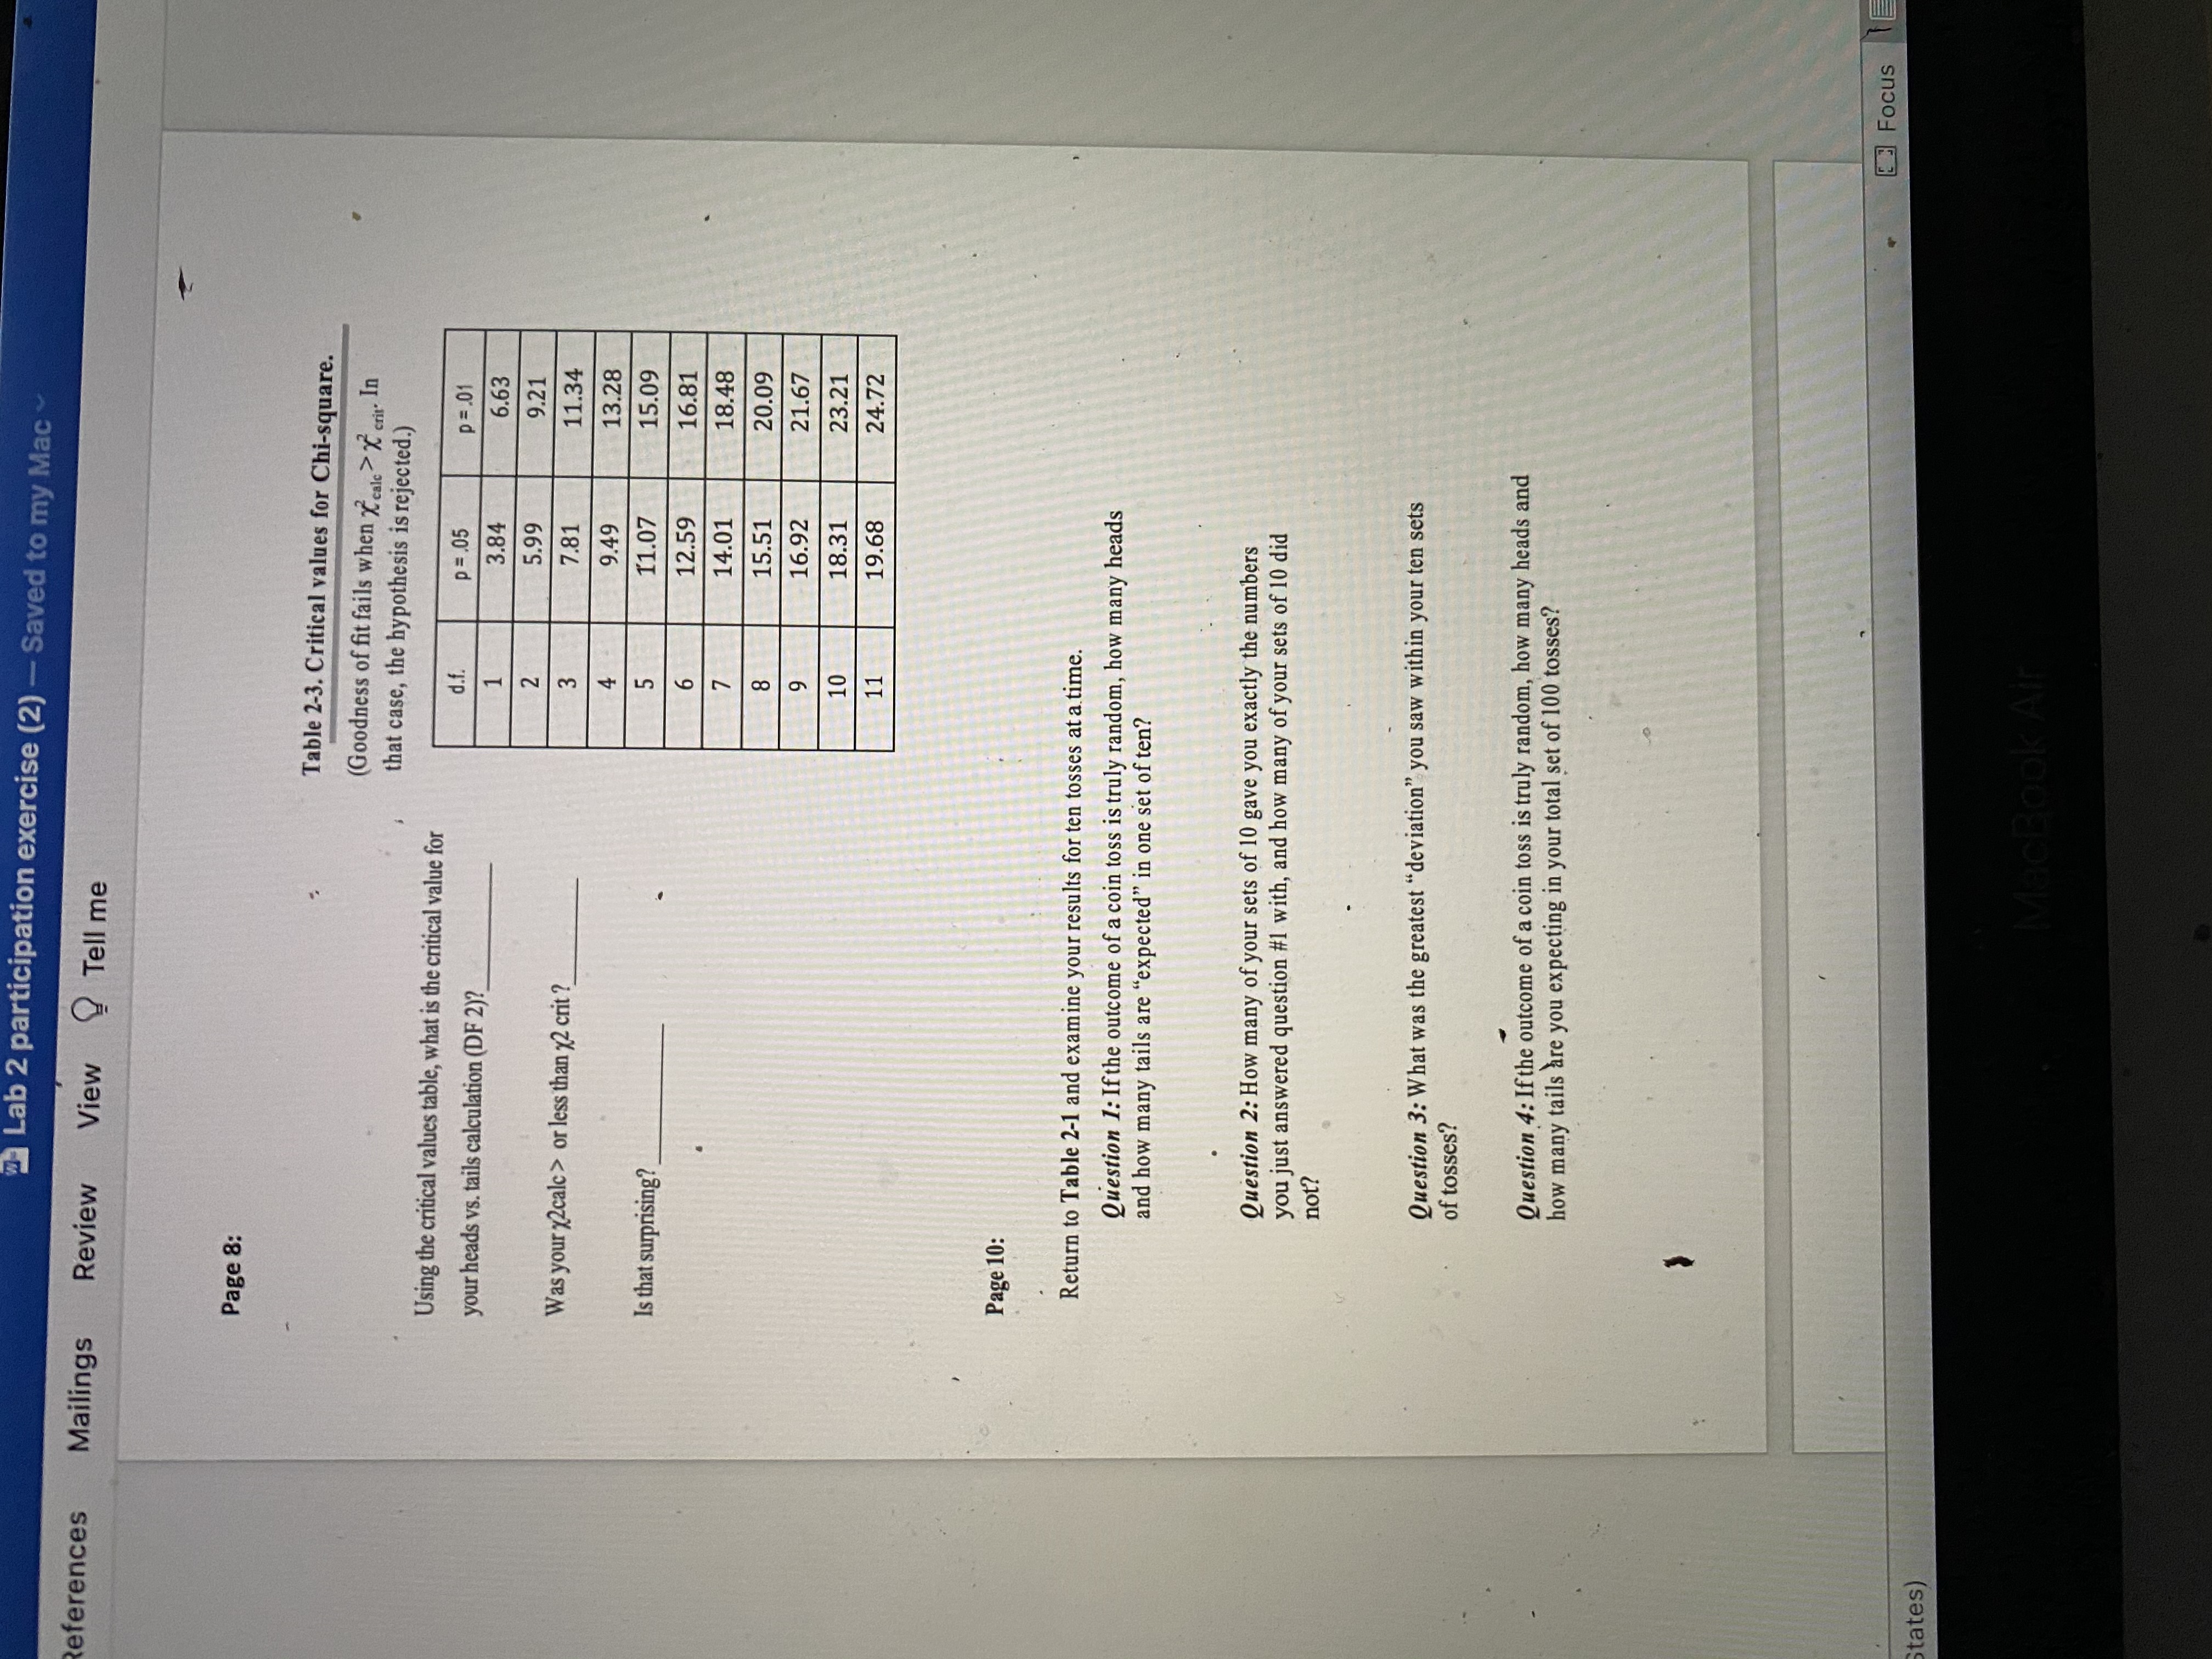
w Lab 2 participation exercise (2) - Saved to my Mac References Mailings Review View Tell me Page 7 One of the most commonly used statistical tools for this kind of analysis is the Chi-square test for goodness of fit." It's embodied in this formula: X = = ( o-e) e In the formula for calculating x2: o = the observed value(s) e = the expected value(s) o-e = the deviation(s) E= summation In the data for your personal coin toss you have two observed values (one for heads and one for tails) and two expected values (heads, tails), and two deviations. The formula says to calculate each deviation (o-e) first, and then operate on each (o-e): square each, divide the resulting quantity by "e" and then sum the two. To do all of this it's probably easiest to set up a table, as below: Table 2-2. Analysis of total heads and tails. heads tails observed ( 0 ) expected (e) o - e (o-e ) ( o-e ) Plug in your personal "observed" and "expected" total coin toss numbers from your set of 100 coin tosses, and then will in the rest of the table. On the bottom line you have calculated two numbers: one that pertains to the "heads" data category, and one that pertains to the "tails" category. What you want now is simply the sum (E) of these separate numbers. Add them and record your Chi-square value here: X = Focus d States) MacBook AirLab 2 participation exercise (2) - Saved to my Mac References Mailings Review View Tell me Page 8: Table 2-3. Critical values for Chi-square. (Goodness of fit fails when Xcalc > W crit- In that case, the hypothesis is rejected.) Using the critical values table, what is the critical value for your heads vs. tails calculation (DF 2)?_ d.f. p =.05 P = .01 1 3.84 6.63 2 5.99 9.21 Was your x2calc > or less than x2 crit ? 3 7.81 11.34 4 9.49 13.28 Is that surprising? 5 11.07 15.09 6 12.59 16.81 7 14.01 18.48 8 15.51 20.09 9 16.92 21.67 10 18.31 23.21 11 19.68 24.72 Page 10: Return to Table 2-1 and examine your results for ten tosses at a time. Question 1: If the outcome of a coin toss is truly random, how many heads and how many tails are "expected" in one set of ten? Question 2: How many of your sets of 10 gave you exactly the numbers you just answered question #1 with, and how many of your sets of 10 did not? Question 3: What was the greatest "deviation" you saw within your ten sets of tosses? Question 4: If the outcome of a coin toss is truly random, how many heads and how many tails are you expecting in your total set of 100 tosses? Focus States) MacBook Air
Step by Step Solution
There are 3 Steps involved in it

Get step-by-step solutions from verified subject matter experts