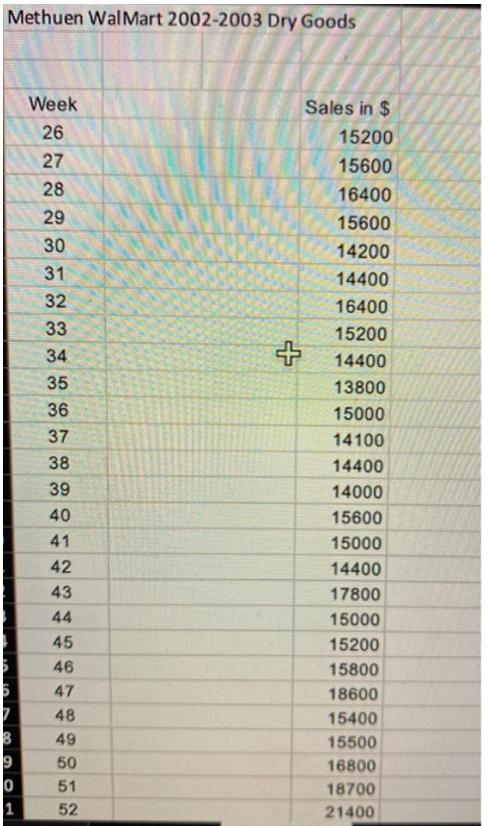
The following items are a guide for responses to be addressed in project one. Note that...
Fantastic news! We've Found the answer you've been seeking!
Question:
Transcribed Image Text:
The following items are a guide for responses to be addressed in project one. Note that WalMart's fiscal year starts the first week of February. This means that when analyzing the data, week 26 is actually week 30 (26+4 weeks for January) in 2002 or the end of July 2002. Also, week 52 is actually week 4 (52+4 weeks for January 2002 minus 52 weeks for 2002) in 2003 or the end of January 2003. As an example, the spike in sales (revenue) at week 75 occurs in week 27 (75+4 weeks for January 2002 minus 52 weeks for 2002) in 2003 or the first week in July 2003. This corresponds to sales for the July 4th holiday when people are buying barbecue related items. All projects must be printed on 8.5x11 paper in a word document with imbedded Excel graphs. No electronic copies or handwritten ones will be accepted. All content must be printed - no handwritten mathematics, graphs, labels, etc. All projects must be stapled. Students are to work separately. Prepare your document with graphs imbedded in the document as if you are a consultant to Walmart. The document show follow a readable format. When doing your least squares modeling of the data, don't forget to generate the model (linear or quadratic) and then remove outliers (extreme values causing spikes in the data) and rerun the model. The results should improve with better R? values. Discuss what outliers were removed and why. Generate supporting Excel graphs (use scatter plots) to answer the following questions for the Dry Goods 2002-2003 data: 1. Identify spikes (outliers) in the data where extreme sales values occur and correlate these spikes with actual calendar dates in 2002 or 2003 and with holidays or special events that may occur during these periods. 2. Modeling the data linearly - a. Generate a linear model for this data by choosing two points. b. Generate a least squares linear regression model for this data. c. How good is this regression model? Output and discuss the R value. d. What are the marginal sales (derivative, i.e. rate of change) for this department using the linear model with two data points and the regression model? e. Compare the two models. Which do you feel is better? f. Remove appropriate outliers as you deem necessary and rerun the linear regression model, What is the marginal sales and discuss improvements. Methuen Wal Mart 2002-2003 Dry Goods Week Sales in $ 26 15200 27 15600 28 16400 29 15600 30 14200 31 14400 32 16400 33 15200 34 14400 35 13800 36 15000 37 14100 38 14400 39 14000 40 15600 41 15000 42 14400 43 17800 44 15000 45 15200 46 15800 47 18600 48 15400 49 15500 50 16800 51 18700 52 21400 The following items are a guide for responses to be addressed in project one. Note that WalMart's fiscal year starts the first week of February. This means that when analyzing the data, week 26 is actually week 30 (26+4 weeks for January) in 2002 or the end of July 2002. Also, week 52 is actually week 4 (52+4 weeks for January 2002 minus 52 weeks for 2002) in 2003 or the end of January 2003. As an example, the spike in sales (revenue) at week 75 occurs in week 27 (75+4 weeks for January 2002 minus 52 weeks for 2002) in 2003 or the first week in July 2003. This corresponds to sales for the July 4th holiday when people are buying barbecue related items. All projects must be printed on 8.5x11 paper in a word document with imbedded Excel graphs. No electronic copies or handwritten ones will be accepted. All content must be printed - no handwritten mathematics, graphs, labels, etc. All projects must be stapled. Students are to work separately. Prepare your document with graphs imbedded in the document as if you are a consultant to Walmart. The document show follow a readable format. When doing your least squares modeling of the data, don't forget to generate the model (linear or quadratic) and then remove outliers (extreme values causing spikes in the data) and rerun the model. The results should improve with better R? values. Discuss what outliers were removed and why. Generate supporting Excel graphs (use scatter plots) to answer the following questions for the Dry Goods 2002-2003 data: 1. Identify spikes (outliers) in the data where extreme sales values occur and correlate these spikes with actual calendar dates in 2002 or 2003 and with holidays or special events that may occur during these periods. 2. Modeling the data linearly - a. Generate a linear model for this data by choosing two points. b. Generate a least squares linear regression model for this data. c. How good is this regression model? Output and discuss the R value. d. What are the marginal sales (derivative, i.e. rate of change) for this department using the linear model with two data points and the regression model? e. Compare the two models. Which do you feel is better? f. Remove appropriate outliers as you deem necessary and rerun the linear regression model, What is the marginal sales and discuss improvements. Methuen Wal Mart 2002-2003 Dry Goods Week Sales in $ 26 15200 27 15600 28 16400 29 15600 30 14200 31 14400 32 16400 33 15200 34 14400 35 13800 36 15000 37 14100 38 14400 39 14000 40 15600 41 15000 42 14400 43 17800 44 15000 45 15200 46 15800 47 18600 48 15400 49 15500 50 16800 51 18700 52 21400
Expert Answer:
Answer rating: 100% (QA)
Answer 2 a Using points 2615200 and 7721200 we get linear equation as y15200 212001520... View the full answer
Related Book For
Financial Reporting and Analysis Using Financial Accounting Information
ISBN: 978-1439080603
12th Edition
Authors: Charles H Gibson
Posted Date:
Students also viewed these accounting questions
-
The following items are from Taperline Corporation on December 31, 2010. Assume a flat 40% corporate tax rate on all items, including the casualty loss. Sales .................. $670,000 Rental...
-
The following items are associated with bonds: Face value Interest expense Carrying value Interest paid Amortization of discount or premium Balance in unamortized discount or premium Required...
-
The following items are based on Reed Companys December 31, 2016, adjusted trial balance: Additional information: 1. Reed had 5,000 shares of common stock outstanding the entire year. 2. The income...
-
Use Theorem 3.11 to evaluate the following limits. THEOREM 3.11 Trigonometric Limits sin x lim X-0 X 1 lim x-0 COS X x = 0
-
Write down the Metropolis-Hastings algorithm for simulating a Markov chain with stationary distribution = (1/6, 2/3, 1/6), using the proposal transition matrix 0 /2 0 1/2 0 1/2 1/2/
-
Consider a European-style option on a non-dividend-paying stock share, whose price follows a geometric Brownian motion with drift 5% and volatility 35% (per year); the continuously compounded...
-
To prepare the statement of cash flows, accountants for Toil-Free Calling, Inc., have summarized 2008 activity in the Cash account as follows: Requirement Prepare the statement of cash flows of...
-
Comparative balance sheets for 2013 and 2012, a statement of income for 2013, and additional information from the accounting records of Red, Inc., are provided below. Additional information from the...
-
[ The following information applies to the questions displayed below. ] Cardinal Company is considering a five - year project that would require a $ 2 , 9 1 5 , 0 0 0 investment in equipment with a...
-
Alexander Smith and his wife Allison are married and file a joint tax return for 2019. The Smiths live at 1234 Buena Vista Drive, Orlando, FL 32830. Alexander is a commuter airline pilot but took 6...
-
Raina bought a put option on a stock for $230. The put gives her the option to sell 100 shares of XYZ stock for $45 a share if she exercises the option in the next ninety days. What is Raina's dollar...
-
1) What are due process rights and why are they important in a democracy? 2) Why is flag burning an example of symbolic speech? 3) Discuss two divergent views on the meaning of the Second Amendment....
-
The selection of an occupation by an individual, as well as the decision to join a particular organization within that occupation, are influenced by the value and culture and not the rewards that are...
-
1)Stefano has a perpetuity immediate that pays $1259.06 quarterly. Tne nominal interest rate is 2.010% compounded monthly. What is the present value of his perpetuity? 2)Keiko has a 18 year annuity...
-
1. Derive the equations x = [1 - e-kt] (cos a) g y = - + -[1 ekt](sin a) + 1/2 (1 kt ekt) - by solving the following initial value problem for a vector r in the plane Differential equation: dr dt =...
-
An EFT for $5 880 is received from Beck Ltd in payment of $6 000 for invoice number 109 dated 13 July. What was the discount rate on this payment?
-
The accounts of Alston Moving Company follow with their normal balances as of August 31, 2024. The accounts are listed in no particular order. (Click the icon to view the accounts.) Prepare Alston's...
-
Explain briefly what is meant by electronic data interchange (EDI). How does EDI affect a companys audit trail?
-
You want profile information on the president of a company. Which reference book should be consulted?
-
Please complete the Web case that covers material discussed in this chapter at www.cengage.com/accounting/Gibson. Youll be using Thomson ONE Business School Edition, a powerful tool that combines a...
-
Comment on the impact on U.S. GAAP if the short-term convergence and the major topics are completed.
-
How reliable is the model in Task 6? Task 6 An HIV researcher explored the factors that influenced condom use with a new partner (relationship less than 1 month old). The outcome measure was whether...
-
An HIV researcher explored the factors that influenced condom use with a new partner (relationship less than 1 month old). The outcome measure was whether a condom was used (use: condom used = 1, not...
-
A female who used a condom in her previous encounter scores 2 on all variables except perceived risk (for which she scores 6). Use the model in Task 6 to estimate the probability that she will use a...
Study smarter with the SolutionInn App