

Question: WAM Athletic Supply, Inc. Five-Year Financial Summary (Partial; adapted) (Dollar amounts in thousands except per share data) 2018 2017 2016 2015 2014 Net Sales Revenue
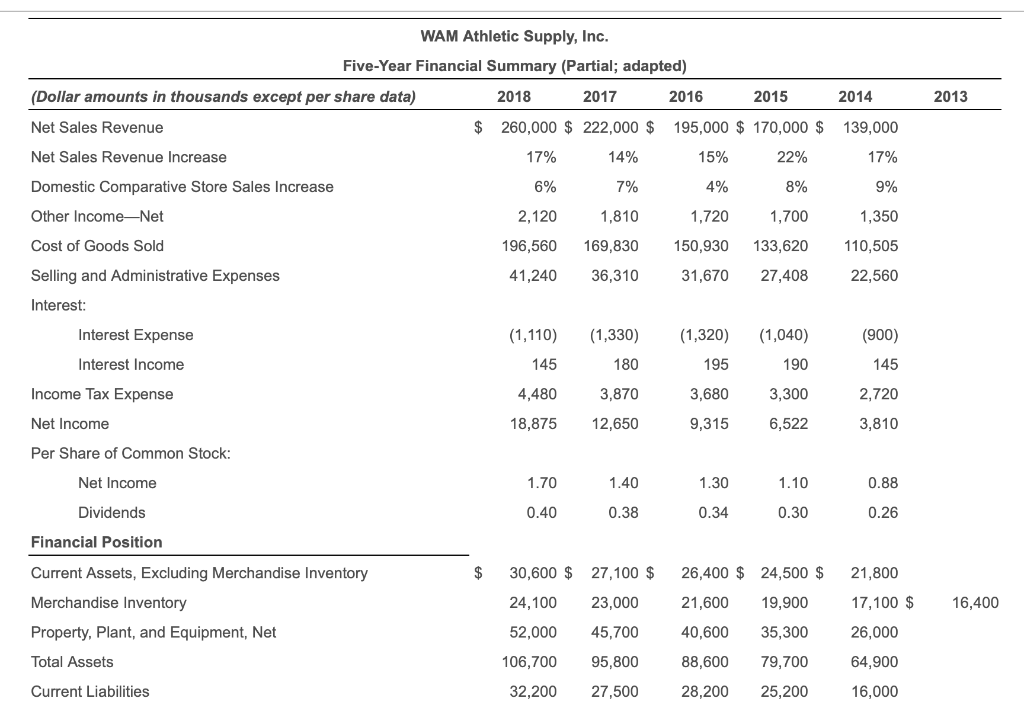
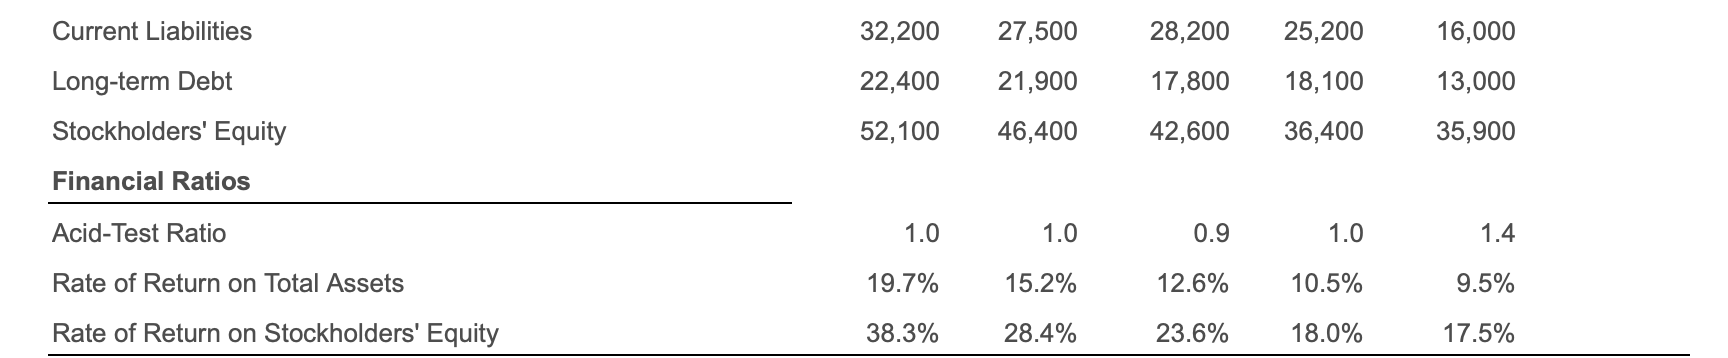
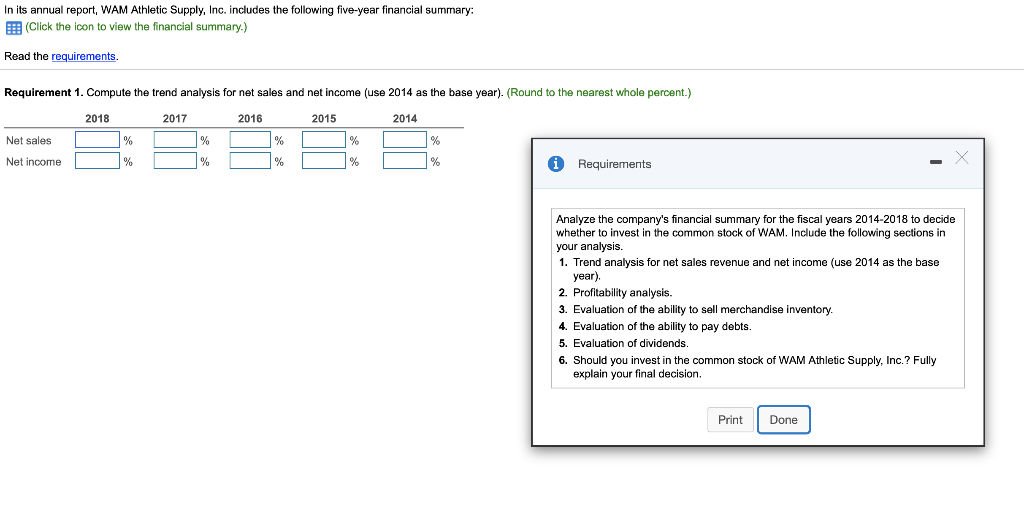
WAM Athletic Supply, Inc. Five-Year Financial Summary (Partial; adapted) (Dollar amounts in thousands except per share data) 2018 2017 2016 2015 2014 Net Sales Revenue $ 260,000 $ 222,000 $ 195,000 $ 170,000 $ 139,000 Net Sales Revenue Increase 17% 14% 15% 22% 17% 2013 6% 7% 4% 8% 9% Domestic Comparative Store Sales Increase Other Income-Net 2,120 1,810 1,720 1,700 1,350 Cost of Goods Sold 196,560 169,830 150,930 133,620 110,505 22,560 41,240 36,310 31,670 27,408 Selling and Administrative Expenses Interest: (1,110) (1,330) (1,040) Interest Expense Interest Income (1,320) 195 (900) 145 145 180 190 Income Tax Expense 4,480 3,870 3,680 3,300 2,720 Net Income 18,875 12,650 9,315 6,522 3,810 Per Share of Common Stock: Net Income 1.70 1.40 1.30 1.10 0.88 0.40 0.38 0.34 0.30 0.26 Dividends Financial Position $ 30,600 $ 27,100 $ 26,400 $ 24,500 $ 21,800 Current Assets, Excluding Merchandise Inventory Merchandise Inventory Property, Plant, and Equipment, Net 24,100 23,000 21,600 19,900 17,100 $ 16,400 52,000 45,700 40,600 35,300 26,000 Total Assets 106,700 95,800 88,600 79,700 64,900 Current Liabilities 32,200 27,500 28,200 25,200 16,000 Current Liabilities 32,200 27,500 28,200 25,200 16,000 Long-term Debt 22,400 21,900 17,800 18,100 13,000 Stockholders' Equity 52,100 46,400 42,600 36,400 35,900 Financial Ratios Acid-Test Ratio 1.0 1.0 0.9 1.0 1.4 Rate of Return on Total Assets 19.7% 15.2% 12.6% 10.5% 9.5% Rate of Return on Stockholders' Equity 38.3% 28.4% 23.6% 18.0% 17.5% In its annual report, WAM Athletic Supply, Inc. includes the following five-year financial summary: (Click the icon to view the financial summary.) Read the requirements. Requirement 1. Compute the trend analysis for net sales and net income (use 2014 as the base year). (Round to the nearest whole percent.) 2018 2017 2016 2015 2014 Net sales % % % % % Net income % % % Requirements Analyze the company's financial summary for the fiscal years 2014-2018 to decide whether to invest in the common stock of WAM. Include the following sections in your analysis. 1. Trend analysis for net sales revenue and net income (use 2014 as the base year) 2. Profitability analysis. 3. Evaluation of the ability to sell merchandise inventory. 4. Evaluation of the ability to pay debts. 5. Evaluation of dividends. 6. Should you invest in the common stock of WAM Athletic Supply, Inc.? Fully explain your final decision. Print Done
Step by Step Solution
There are 3 Steps involved in it

Get step-by-step solutions from verified subject matter experts