

Question: Want the answers in Matlab code Script 3. Write a script that first load a file 'diameter.dat' (which is posted on canvas) stores times and
Want the answers in Matlab code Script
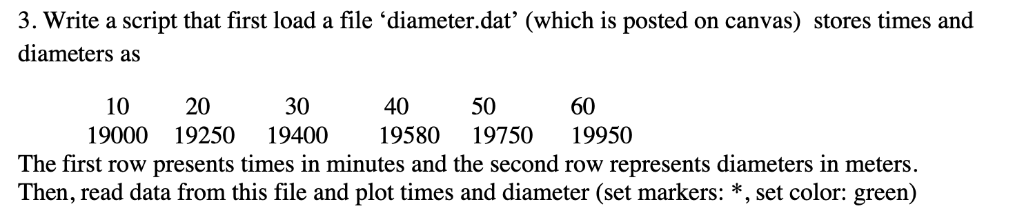
3. Write a script that first load a file 'diameter.dat' (which is posted on canvas) stores times and diameters as 10 20 19000 19250 1940019580 19750 19950 30 40 50 60 The first row presents times in minutes and the second row represents diameters in meters. Then, read data from this file and plot times and diameter (set markers: *, set color: green)
Step by Step Solution
There are 3 Steps involved in it
1 Expert Approved Answer
Step: 1 Unlock

Question Has Been Solved by an Expert!
Get step-by-step solutions from verified subject matter experts
Step: 2 Unlock
Step: 3 Unlock