

Question: Warranty Reason Code Warranty Reason Description E Engine T Transmission S Suspension C Circuitry/Electrical B Brakes P Power Steering Can I get step by step
| Warranty Reason Code | Warranty Reason Description |
| E | Engine |
| T | Transmission |
| S | Suspension |
| C | Circuitry/Electrical |
| B | Brakes |
| P | Power Steering |
Can I get step by step direction on how to complete this?
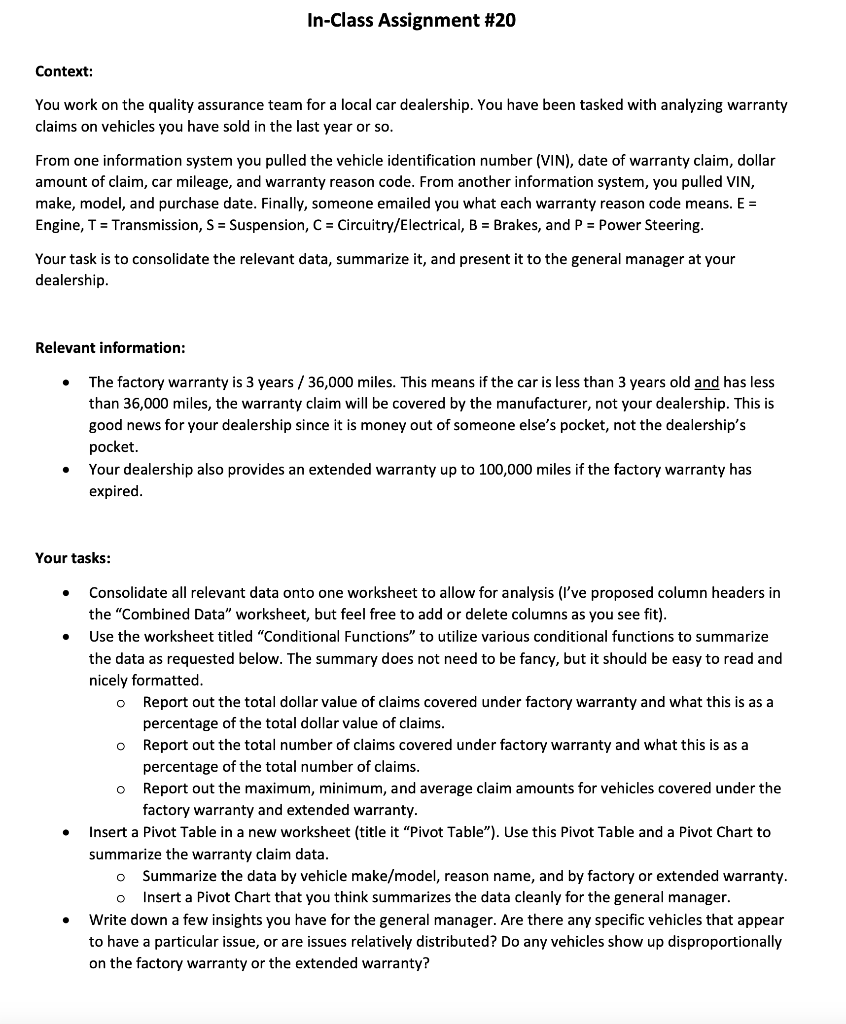
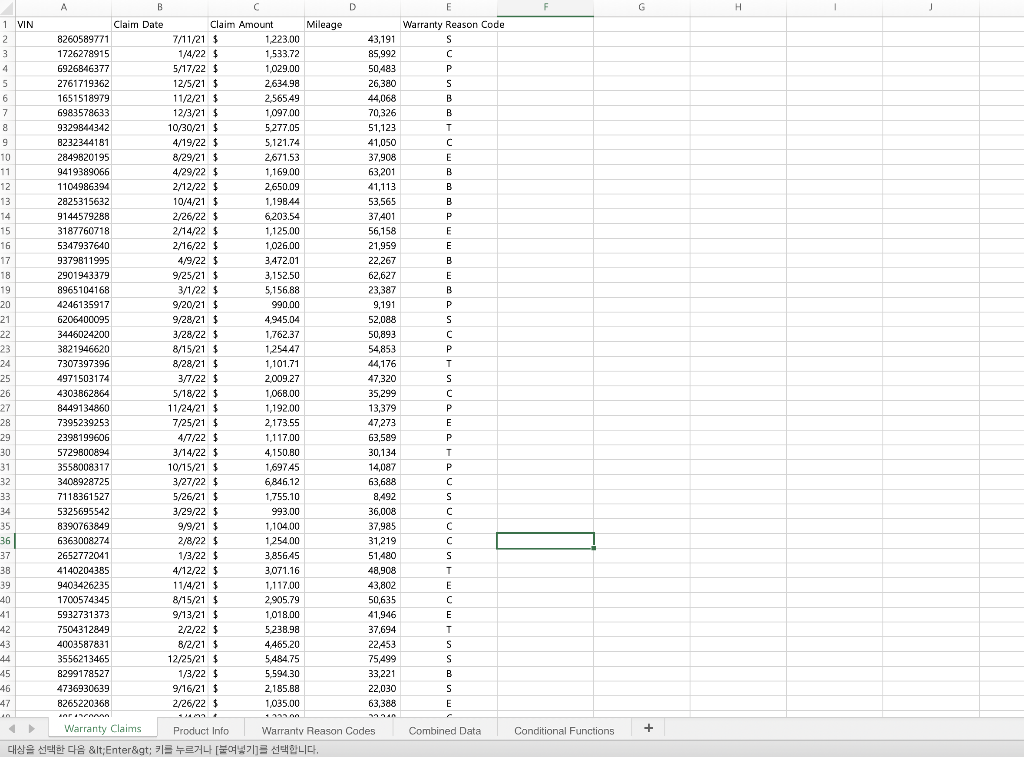
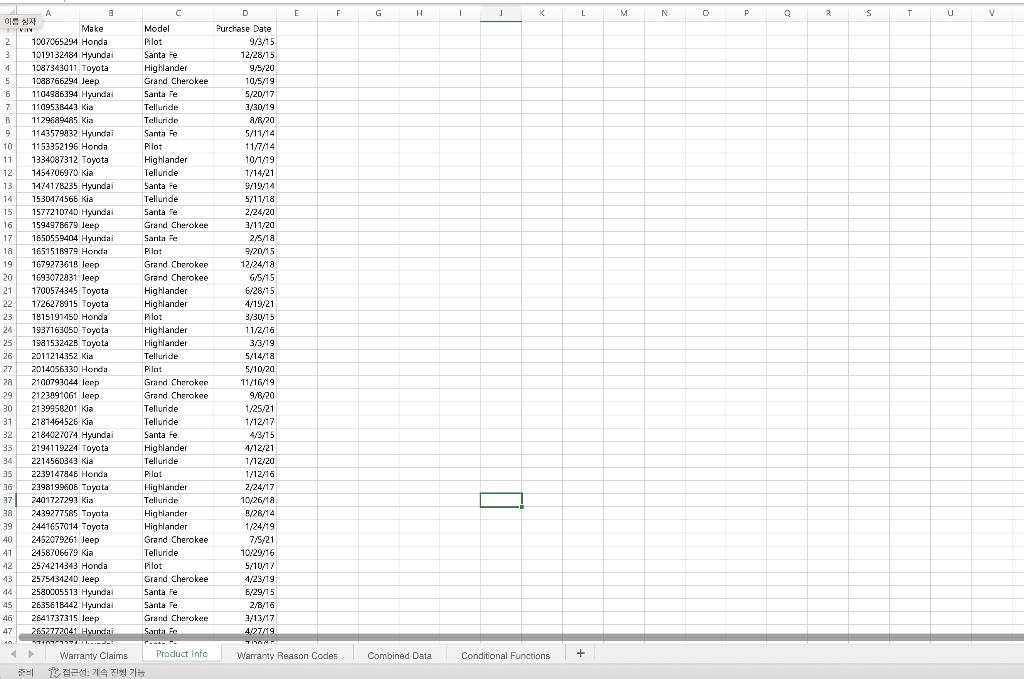
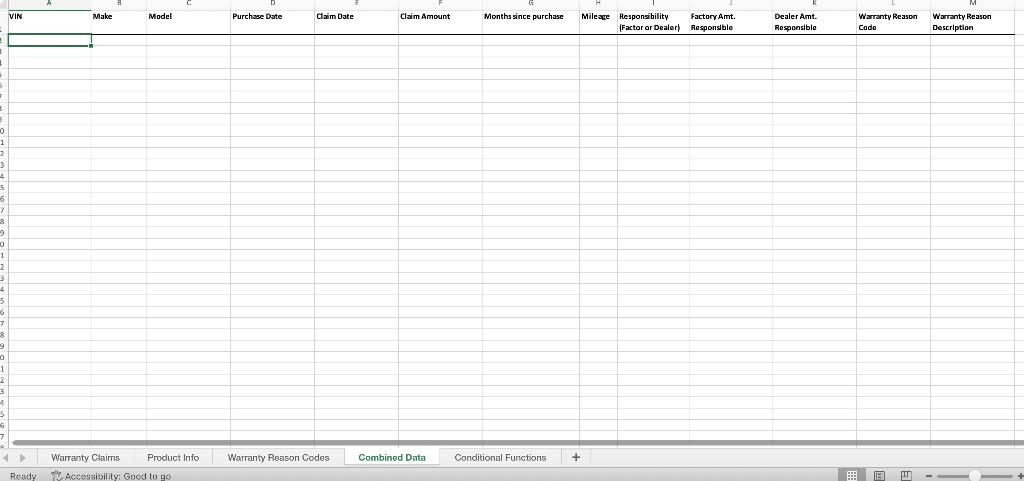
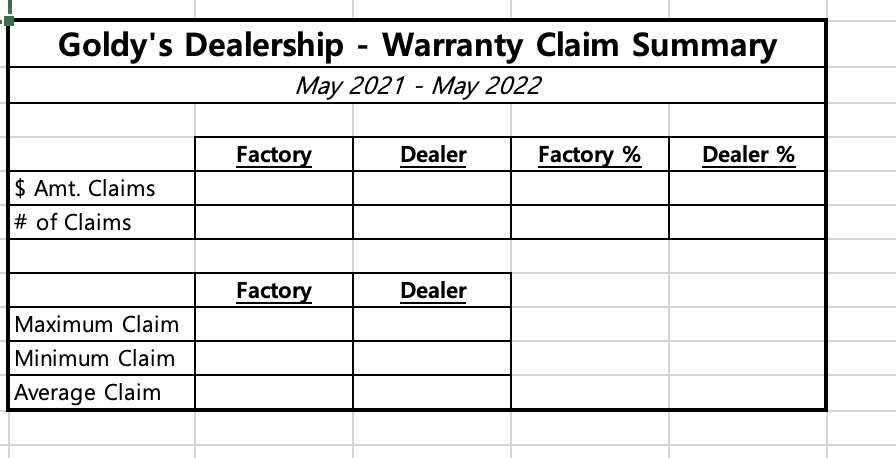
Context: You work on the quality assurance team for a local car dealership. You have been tasked with analyzing warranty claims on vehicles you have sold in the last year or so. From one information system you pulled the vehicle identification number (VIN), date of warranty claim, dollar amount of claim, car mileage, and warranty reason code. From another information system, you pulled VIN, make, model, and purchase date. Finally, someone emailed you what each warranty reason code means. E= Engine, T= Transmission, S= Suspension, C= Circuitry/Electrical, B= Brakes, and P= Power Steering. Your task is to consolidate the relevant data, summarize it, and present it to the general manager at your dealership. Relevant information: - The factory warranty is 3 years /36,000 miles. This means if the car is less than 3 years old and has less than 36,000 miles, the warranty claim will be covered by the manufacturer, not your dealership. This is good news for your dealership since it is money out of someone else's pocket, not the dealership's pocket. - Your dealership also provides an extended warranty up to 100,000 miles if the factory warranty has expired. Your tasks: - Consolidate all relevant data onto one worksheet to allow for analysis (I've proposed column headers in the "Combined Data" worksheet, but feel free to add or delete columns as you see fit). - Use the worksheet titled "Conditional Functions" to utilize various conditional functions to summarize the data as requested below. The summary does not need to be fancy, but it should be easy to read and nicely formatted. - Report out the total dollar value of claims covered under factory warranty and what this is as a percentage of the total dollar value of claims. - Report out the total number of claims covered under factory warranty and what this is as a percentage of the total number of claims. - Report out the maximum, minimum, and average claim amounts for vehicles covered under the factory warranty and extended warranty. - Insert a Pivot Table in a new worksheet (title it "Pivot Table"). Use this Pivot Table and a Pivot Chart to summarize the warranty claim data. - Summarize the data by vehicle make/model, reason name, and by factory or extended warranty. - Insert a Pivot Chart that you think summarizes the data cleanly for the general manager. - Write down a few insights you have for the general manager. Are there any specific vehicles that appear to have a particular issue, or are issues relatively distributed? Do any vehicles show up disproportionally on the factory warranty or the extended warranty? \
Step by Step Solution
There are 3 Steps involved in it

Get step-by-step solutions from verified subject matter experts