

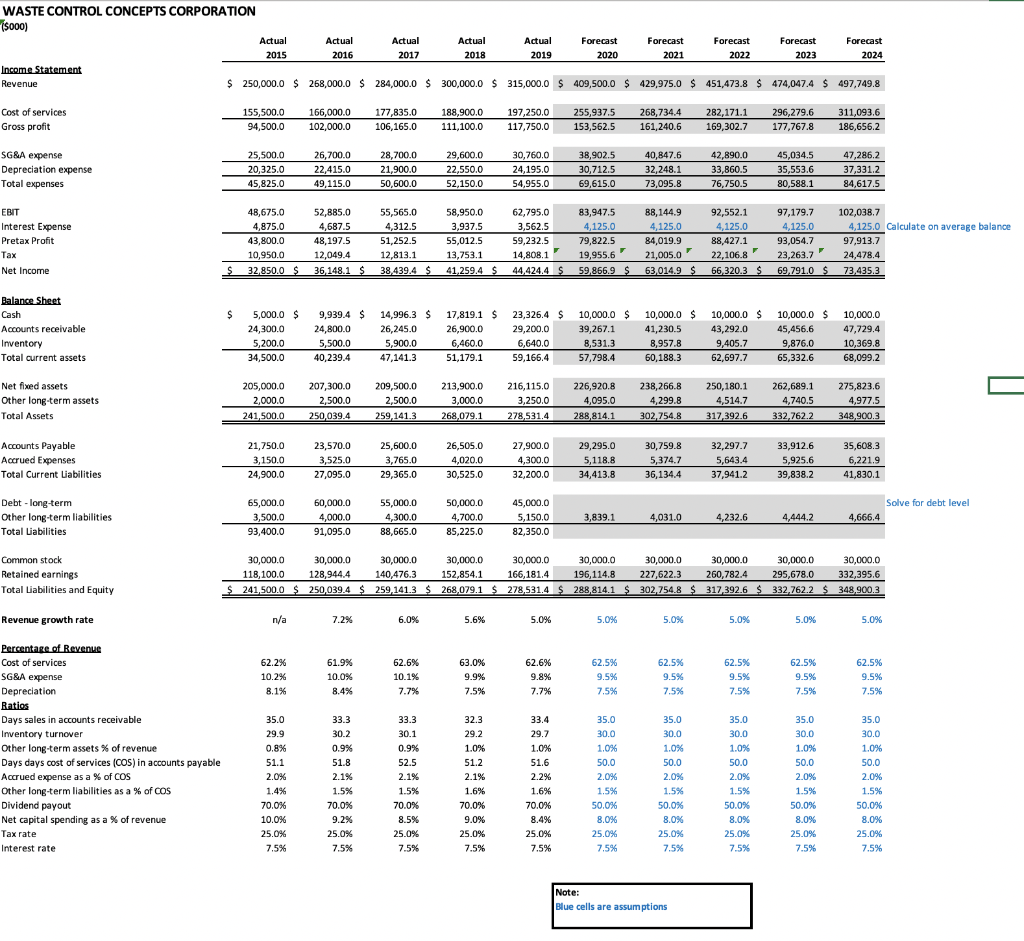
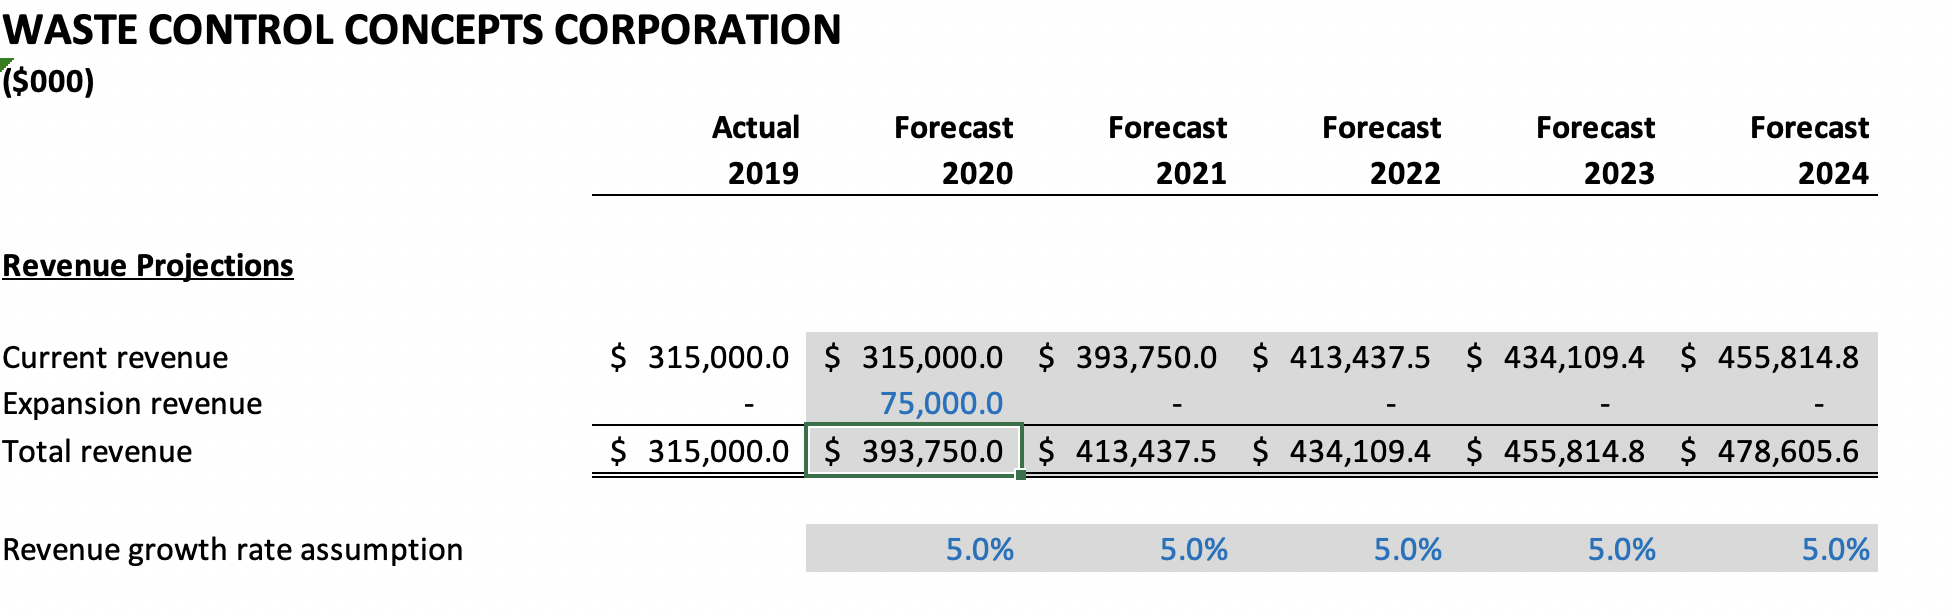
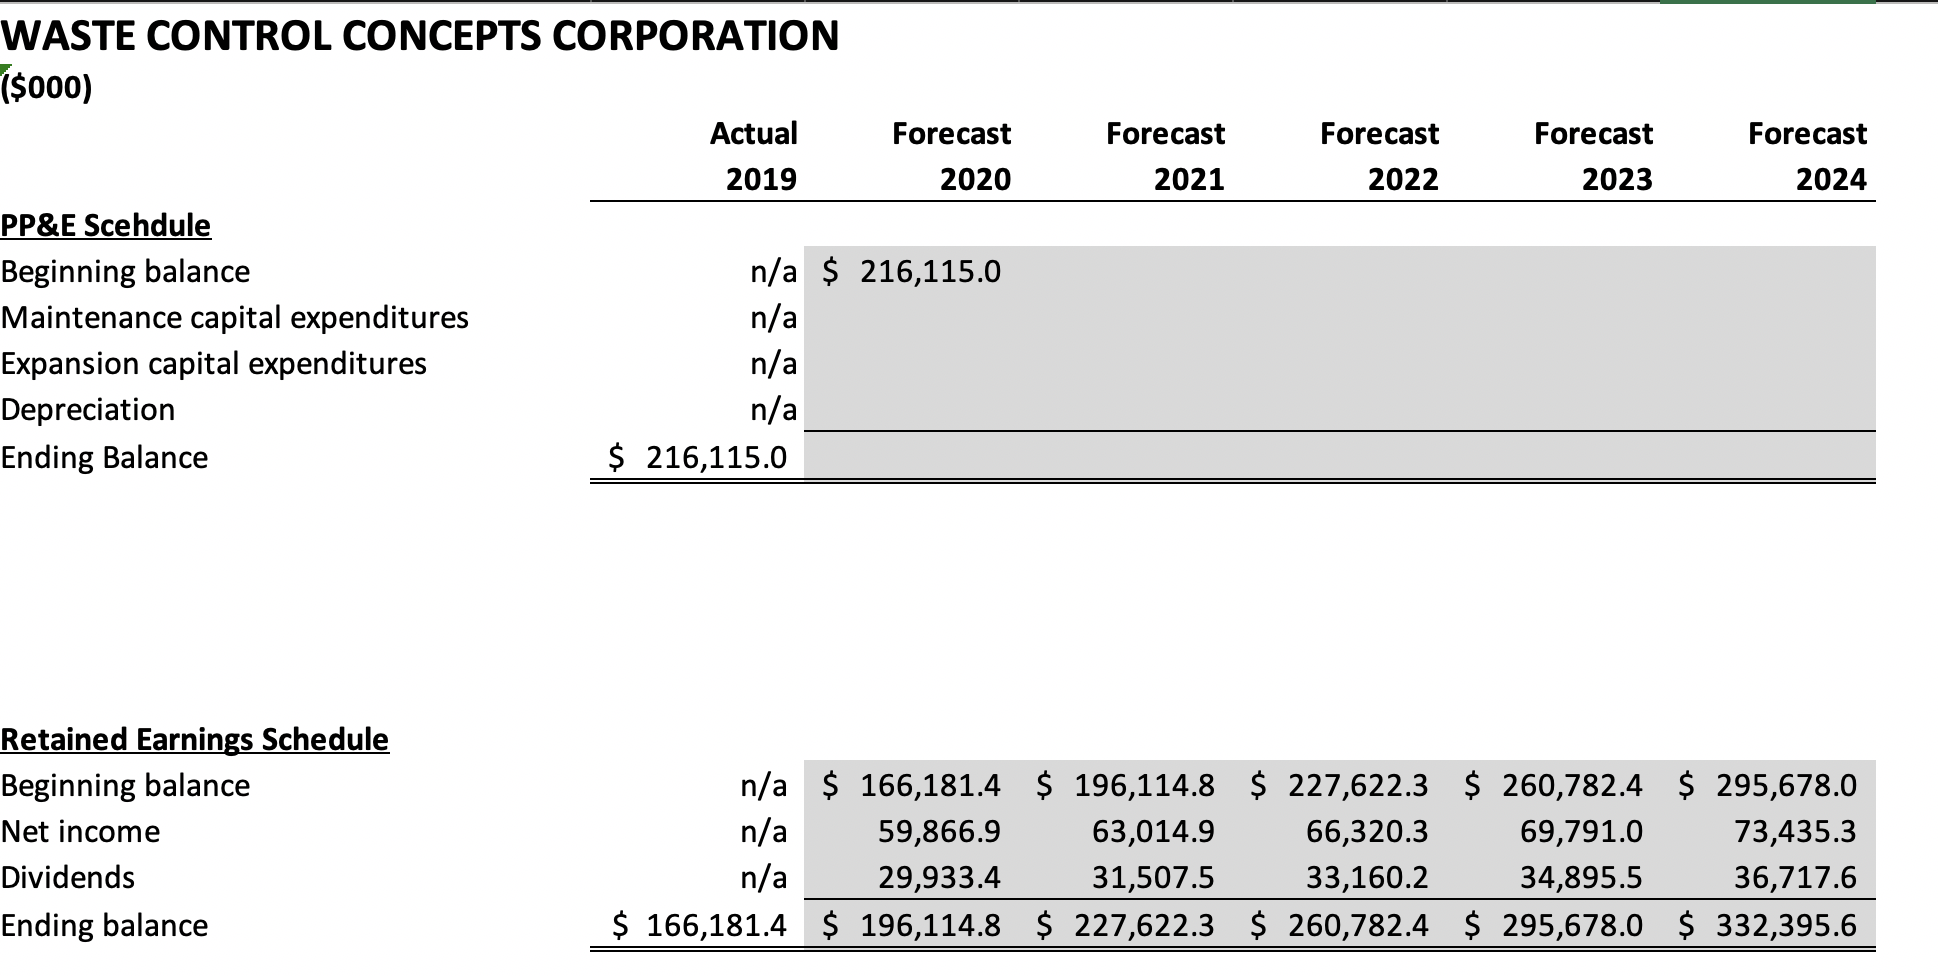
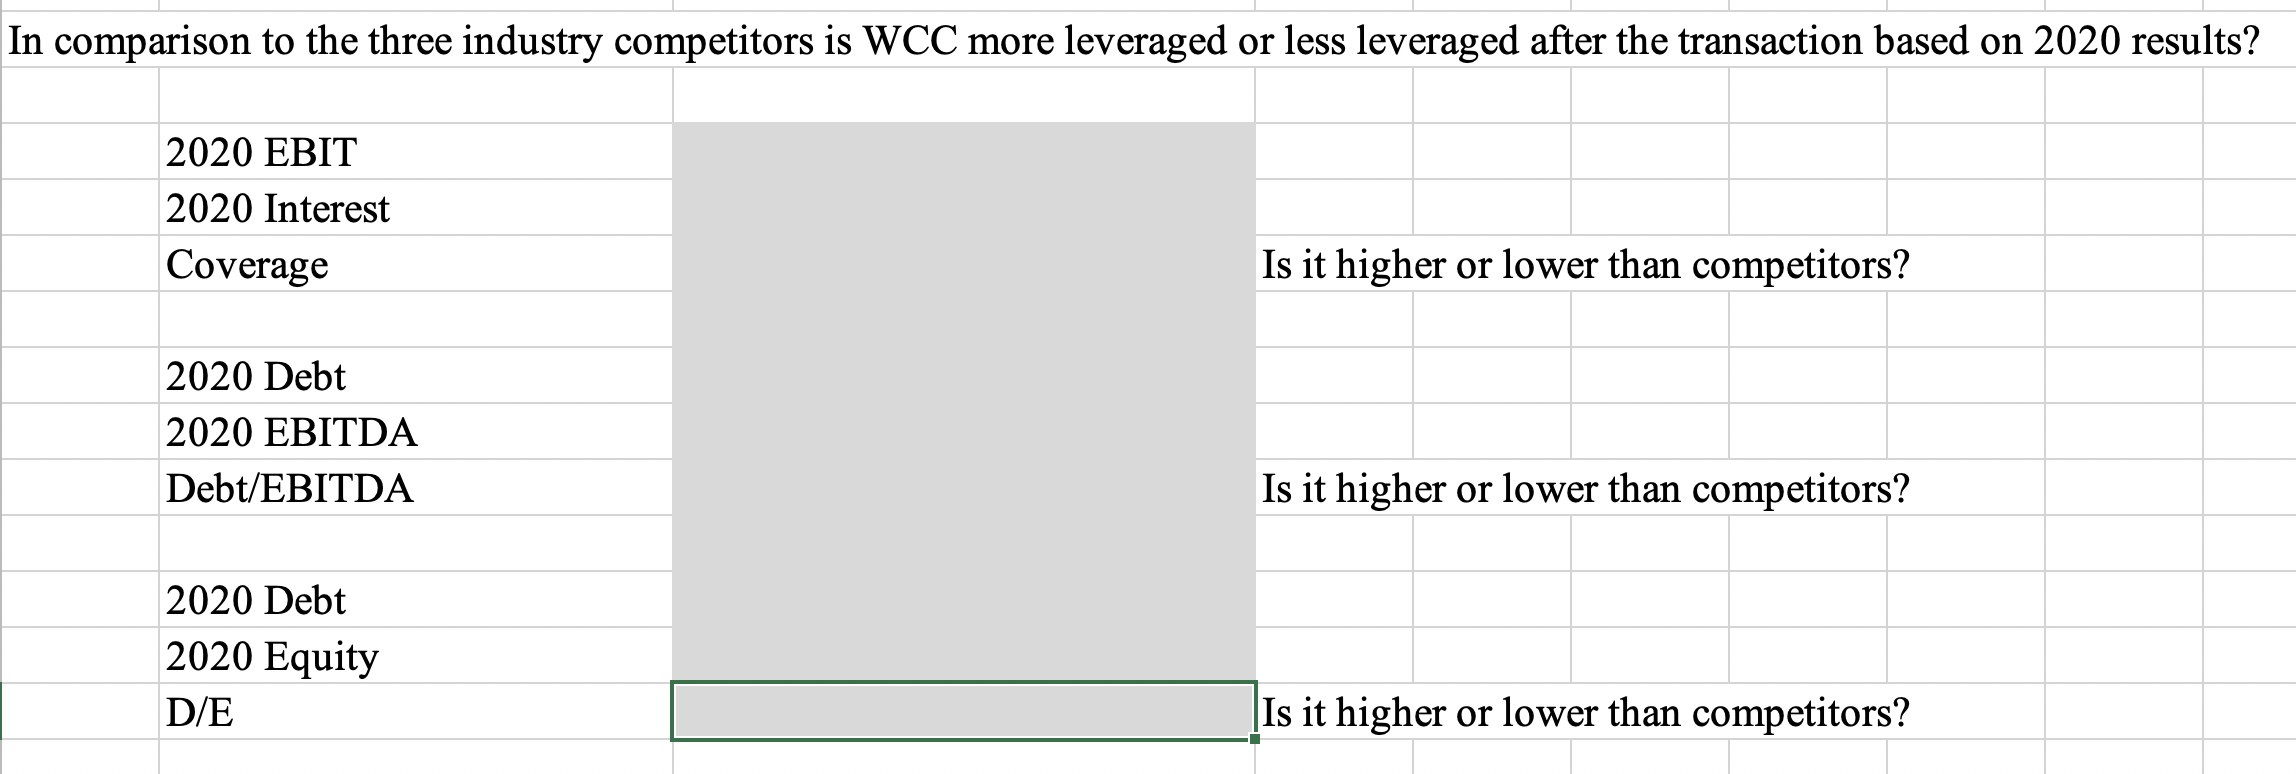
WASTE CONTROL CONCEPTS CORPORATION (S000) Income Statement Revenue Cost of services Gross profit SG&A expense Depreciation...
Fantastic news! We've Found the answer you've been seeking!
Question:
Transcribed Image Text:
WASTE CONTROL CONCEPTS CORPORATION (S000) Income Statement Revenue Cost of services Gross profit SG&A expense Depreciation expense Total expenses EBIT Interest Expense Pretax Profit Tax Net Income Balance Sheet Cash Accounts receivable Inventory Total current assets Net fixed assets Other long-term assets Total Assets Accounts Payable Accrued Expenses Total Current Liabilities Debt-long-term Other long-term liabilities Total Liabilities Common stock Retained earnings Total Liabilities and Equity Revenue growth rate Percentage of Revenue Cost of services SG&A expense Depreciation Ratios Days sales in accounts receivable Inventory turnover Other long-term assets % of revenue Days days cost of services (COS) in accounts payable Accrued expense as a % of COS Other long-term liabilities as a % of COS Dividend payout Net capital spending as a % of revenue Tax rate Interest rate Actual Actual Actual Forecast Actual 2018 Actual 2019 Forecast 2020 Forecast 2021 Forecast 2022 Forecast 2023 2015 2016 2017 2024 $ 250,000.0 $ 268,000.0 $ 284,000.0 $300,000.0 $ 315,000.0 $ 409,500.0 $ 429,975.0 $ 451,473.8 $ 474,047.4 $497,749.8 155,500.0 94,500.0 166,000.0 102,000.0 177,835.0 106,165.0 188,900.0 197,250.0 255,937.5 268,734.4 111,100.0 117,750.0 153,562.5 161,240.6 282.171.1 169,302.7 296,279.6 311,093.6 177,767.8 186,656.2 26,700.0 28,700.0 29,600.0 30,760.0 38,902.5 40,847.6 42,890.0 45,034.5 47,286.2 25,500.0 20,325.0 22,415.0 21,900.0 22,550.0 24,195.0 30,712.5 32,248.1 33,860.5 35,553.6 37,331.2 45,825.0 49,115.0 50,600.0 52,150.0 54,955.0 69,615.0 73,095.8 76,750.5 80,588.1 84,617.5 48,675.0 52,885.0 55,565.0 58,950.0 62,795.0 83,947.5 88,144.9 92,552.1 97,179.7 102,038.7 4,875.0 4,687.5 4,312.5 3,937.5 3,562.5 4,125.0 4,125.0 4,125.0 4,125.0 4,125.0 Calculate on average balance 43,800.0 48,197.5 59,232.5 79,822.5 84,019.9 88,427.1 51,252.5 12,813.1 F 10,950.0 55,012.5 13,753.1 41.259.4 $ 14,808.1 19,955.6 21,005.0 12,049.4 36,148.1 $ 22,106.8 93,054.7 23,263.7 69,791.0 $ 97,913.7 24,478.4 73,435.3 $ 32,850.0 $ 38,439.4 $ 44,424.4 S 59,866.9 $ 63,014.9 $ 66,320.3 $ $ 14,996.3 $ 17,819.1 $ 10,000.0 $ 10,000.0 $ 10,000.0 $ 10,000,0 $ 5,000.0 $ 24,300.0 5,200.0 9,939.4 $ 24,800.0 5.500.0 23,326.4 $ 29,200.0 10,000.0 47,729.4 26,900.0 39,267.1 41,230.5 43,292.0 45,456.6 26,245.0 5,900.0 6,460.0 6,640.0 8,531.3 8.957.8 9,405.7 9,876.0 10,369.8 34,500.0 40,239.4 47,141.3 51,179.1 59,166.4 57,798.4 60,188.3 62,697.7 65,332.6 68,099.2 205,000.0 213,900.0 216,115.0 207,300.0 2,500.0 275,823.6 238,266.8 250,180.1 262,689.1 209,500.0 2,500.0 226,920.8 4,095.0 2,000.0 3,000.0 3,250.0 4.299.8 4,514.7 4,740.5 4,977.5 241,500.0 250,039.4 259,141.3 268,079.1 278,531.4 288,814.1 302.754.8 317,392.6 332,762.2 348,900.3 21,750.0 23,570.0 25,600.0 26,505.0 27,900.0 29,295.0 30,759.8 32,297.7 33,912.6 35,608.3 3,150.0 3,525.0 3,765.0 4,020.0 4,300.0 5,118.8 5,374.7 5,643.4 5,925.6 6,221.9 24,900.0 27,095.0 29,365.0 30,525.0 32,200.0 34,413.8 36,134.4 37,941.2 39,838.2 41,830.1 65,000.0 60,000.0 55,000.0 50,000.0 45,000.0 3,500.0 4,000.0 4,300.0 4,700.0 5,150.0 3,839.1 4,031.0 4,232.6 4,444.2 4,666.4 93,400.0 91.095.0 88,665.0 85,225.0 82,350.0 30,000.0 30,000.0 118,100.0 30,000.0 30,000.0 128,944.4 140,476.3 30,000.0 152,854.1 30,000.0 166.181.4 30,000.0 30,000.0 196,114.8 227,622.3 30,000.0 30,000.0 260,782.4 295,678.0 332,395.6 $ 241,500.0 $ 250,039.4 $ 259,141.3 $ 268,079.1 $278,531.4 $288,814.1 $ 302,754.8 $ 317,392.6 $ 332,762.2 $ 348,900.3 n/a 7.2% 6.0% 5.6% 5.0% 5.0% 5.0% 5.0% 5.0% 5.0% 62.2% 61.9% 62.6% 63.0% 62.6% 62.5% 62.5% 62.5% 62.5% 62.5% 10.2% 10.0% 10.1% 9.9% 9.8% 9.5% 9.5% 9.5% 9.5% 9.5% 8.1% 8.4% 7.7% 7.5% 7.7% 7.5% 7.5% 7.5% 7.5% 7.5% 35.0 33.3 33.3 32.3 33.4 35.0 35.0 35.0 35.0 35.0 29.9 30.2 30.1 29.2 29.7 30.0 30.0 30.0 30.0 30.0 0.8% 0.9% 0.9% 1.0% 1.0% 1.0% 1.0% 1.0% 1.0% 1.0% 51.1 51.8 52.5 51.2 51.6 50.0 50.0 50.0 50.0 50.0 2.0% 2.1% 2.1% 2.1% 2.2% 2.0% 2.0% 2.0% 2.0% 2.0% 1.4% 1.5% 1.5% 1.6% 1.6% 1.5% 1.5% 1.5% 1.5% 1.5% 70.0% 70.0% 70.0% 70.0% 70.0% 50.0% 50.0% 50.0% 50.0% 50.0% 10.0% 9.2% 8.5% 9.0% 8.4% 8.0% 8.0% 8.0% 8.0% 8.0% 25.0% 25.0% 25.0% 25.0% 25.0% 25.0% 25.0% 25.0% 25.0% 25.0% 7.5% 7.5% 7.5% 7.5% 7.5% 7.5% 7.5% 7.5% 7.5% 7.5% Note: Blue cells are assumptions Solve for debt level WASTE CONTROL CONCEPTS CORPORATION ($000) Forecast Forecast Forecast Forecast Forecast Actual 2019 2020 2021 2022 2023 2024 Revenue Projections Current revenue $ 315,000.0 $ 315,000.0 $ 393,750.0 $ 413,437.5 $ 434,109.4 $ 455,814.8 Expansion revenue 75,000.0 Total revenue $ 315,000.0 $ 393,750.0 $ 413,437.5 $ 434,109.4 $ 455,814.8 $ 478,605.6 Revenue growth rate assumption 5.0% 5.0% 5.0% 5.0% 5.0% WASTE CONTROL CONCEPTS CORPORATION ($000) Actual 2019 PP&E Scehdule Beginning balance Maintenance capital expenditures Expansion capital expenditures Depreciation Ending Balance Retained Earnings Schedule Beginning balance Net income Dividends Ending balance Forecast 2020 n/a $ 216,115.0 n/a n/a n/a $ 216,115.0 Forecast Forecast Forecast Forecast 2024 2021 2022 2023 n/a $ 166,181.4 $ 196,114.8 $ 227,622.3 $ 260,782.4 $ 295,678.0 n/a 59,866.9 63,014.9 31,507.5 66,320.3 33,160.2 69,791.0 34,895.5 73,435.3 36,717.6 n/a 29,933.4 $ 166,181.4 $ 196,114.8 $ 227,622.3 $ 260,782.4 $ 295,678.0 $ 332,395.6 In comparison to the three industry competitors is WCC more leveraged or less leveraged after the transaction based on 2020 results? 2020 EBIT 2020 Interest Coverage Is it higher or lower than competitors? 2020 Debt 2020 EBITDA Debt/EBITDA Is it higher or lower than competitors? 2020 Debt 2020 Equity D/E Is it higher or lower than competitors? WASTE CONTROL CONCEPTS CORPORATION (S000) Income Statement Revenue Cost of services Gross profit SG&A expense Depreciation expense Total expenses EBIT Interest Expense Pretax Profit Tax Net Income Balance Sheet Cash Accounts receivable Inventory Total current assets Net fixed assets Other long-term assets Total Assets Accounts Payable Accrued Expenses Total Current Liabilities Debt-long-term Other long-term liabilities Total Liabilities Common stock Retained earnings Total Liabilities and Equity Revenue growth rate Percentage of Revenue Cost of services SG&A expense Depreciation Ratios Days sales in accounts receivable Inventory turnover Other long-term assets % of revenue Days days cost of services (COS) in accounts payable Accrued expense as a % of COS Other long-term liabilities as a % of COS Dividend payout Net capital spending as a % of revenue Tax rate Interest rate Actual Actual Actual Forecast Actual 2018 Actual 2019 Forecast 2020 Forecast 2021 Forecast 2022 Forecast 2023 2015 2016 2017 2024 $ 250,000.0 $ 268,000.0 $ 284,000.0 $300,000.0 $ 315,000.0 $ 409,500.0 $ 429,975.0 $ 451,473.8 $ 474,047.4 $497,749.8 155,500.0 94,500.0 166,000.0 102,000.0 177,835.0 106,165.0 188,900.0 197,250.0 255,937.5 268,734.4 111,100.0 117,750.0 153,562.5 161,240.6 282.171.1 169,302.7 296,279.6 311,093.6 177,767.8 186,656.2 26,700.0 28,700.0 29,600.0 30,760.0 38,902.5 40,847.6 42,890.0 45,034.5 47,286.2 25,500.0 20,325.0 22,415.0 21,900.0 22,550.0 24,195.0 30,712.5 32,248.1 33,860.5 35,553.6 37,331.2 45,825.0 49,115.0 50,600.0 52,150.0 54,955.0 69,615.0 73,095.8 76,750.5 80,588.1 84,617.5 48,675.0 52,885.0 55,565.0 58,950.0 62,795.0 83,947.5 88,144.9 92,552.1 97,179.7 102,038.7 4,875.0 4,687.5 4,312.5 3,937.5 3,562.5 4,125.0 4,125.0 4,125.0 4,125.0 4,125.0 Calculate on average balance 43,800.0 48,197.5 59,232.5 79,822.5 84,019.9 88,427.1 51,252.5 12,813.1 F 10,950.0 55,012.5 13,753.1 41.259.4 $ 14,808.1 19,955.6 21,005.0 12,049.4 36,148.1 $ 22,106.8 93,054.7 23,263.7 69,791.0 $ 97,913.7 24,478.4 73,435.3 $ 32,850.0 $ 38,439.4 $ 44,424.4 S 59,866.9 $ 63,014.9 $ 66,320.3 $ $ 14,996.3 $ 17,819.1 $ 10,000.0 $ 10,000.0 $ 10,000.0 $ 10,000,0 $ 5,000.0 $ 24,300.0 5,200.0 9,939.4 $ 24,800.0 5.500.0 23,326.4 $ 29,200.0 10,000.0 47,729.4 26,900.0 39,267.1 41,230.5 43,292.0 45,456.6 26,245.0 5,900.0 6,460.0 6,640.0 8,531.3 8.957.8 9,405.7 9,876.0 10,369.8 34,500.0 40,239.4 47,141.3 51,179.1 59,166.4 57,798.4 60,188.3 62,697.7 65,332.6 68,099.2 205,000.0 213,900.0 216,115.0 207,300.0 2,500.0 275,823.6 238,266.8 250,180.1 262,689.1 209,500.0 2,500.0 226,920.8 4,095.0 2,000.0 3,000.0 3,250.0 4.299.8 4,514.7 4,740.5 4,977.5 241,500.0 250,039.4 259,141.3 268,079.1 278,531.4 288,814.1 302.754.8 317,392.6 332,762.2 348,900.3 21,750.0 23,570.0 25,600.0 26,505.0 27,900.0 29,295.0 30,759.8 32,297.7 33,912.6 35,608.3 3,150.0 3,525.0 3,765.0 4,020.0 4,300.0 5,118.8 5,374.7 5,643.4 5,925.6 6,221.9 24,900.0 27,095.0 29,365.0 30,525.0 32,200.0 34,413.8 36,134.4 37,941.2 39,838.2 41,830.1 65,000.0 60,000.0 55,000.0 50,000.0 45,000.0 3,500.0 4,000.0 4,300.0 4,700.0 5,150.0 3,839.1 4,031.0 4,232.6 4,444.2 4,666.4 93,400.0 91.095.0 88,665.0 85,225.0 82,350.0 30,000.0 30,000.0 118,100.0 30,000.0 30,000.0 128,944.4 140,476.3 30,000.0 152,854.1 30,000.0 166.181.4 30,000.0 30,000.0 196,114.8 227,622.3 30,000.0 30,000.0 260,782.4 295,678.0 332,395.6 $ 241,500.0 $ 250,039.4 $ 259,141.3 $ 268,079.1 $278,531.4 $288,814.1 $ 302,754.8 $ 317,392.6 $ 332,762.2 $ 348,900.3 n/a 7.2% 6.0% 5.6% 5.0% 5.0% 5.0% 5.0% 5.0% 5.0% 62.2% 61.9% 62.6% 63.0% 62.6% 62.5% 62.5% 62.5% 62.5% 62.5% 10.2% 10.0% 10.1% 9.9% 9.8% 9.5% 9.5% 9.5% 9.5% 9.5% 8.1% 8.4% 7.7% 7.5% 7.7% 7.5% 7.5% 7.5% 7.5% 7.5% 35.0 33.3 33.3 32.3 33.4 35.0 35.0 35.0 35.0 35.0 29.9 30.2 30.1 29.2 29.7 30.0 30.0 30.0 30.0 30.0 0.8% 0.9% 0.9% 1.0% 1.0% 1.0% 1.0% 1.0% 1.0% 1.0% 51.1 51.8 52.5 51.2 51.6 50.0 50.0 50.0 50.0 50.0 2.0% 2.1% 2.1% 2.1% 2.2% 2.0% 2.0% 2.0% 2.0% 2.0% 1.4% 1.5% 1.5% 1.6% 1.6% 1.5% 1.5% 1.5% 1.5% 1.5% 70.0% 70.0% 70.0% 70.0% 70.0% 50.0% 50.0% 50.0% 50.0% 50.0% 10.0% 9.2% 8.5% 9.0% 8.4% 8.0% 8.0% 8.0% 8.0% 8.0% 25.0% 25.0% 25.0% 25.0% 25.0% 25.0% 25.0% 25.0% 25.0% 25.0% 7.5% 7.5% 7.5% 7.5% 7.5% 7.5% 7.5% 7.5% 7.5% 7.5% Note: Blue cells are assumptions Solve for debt level WASTE CONTROL CONCEPTS CORPORATION ($000) Forecast Forecast Forecast Forecast Forecast Actual 2019 2020 2021 2022 2023 2024 Revenue Projections Current revenue $ 315,000.0 $ 315,000.0 $ 393,750.0 $ 413,437.5 $ 434,109.4 $ 455,814.8 Expansion revenue 75,000.0 Total revenue $ 315,000.0 $ 393,750.0 $ 413,437.5 $ 434,109.4 $ 455,814.8 $ 478,605.6 Revenue growth rate assumption 5.0% 5.0% 5.0% 5.0% 5.0% WASTE CONTROL CONCEPTS CORPORATION ($000) Actual 2019 PP&E Scehdule Beginning balance Maintenance capital expenditures Expansion capital expenditures Depreciation Ending Balance Retained Earnings Schedule Beginning balance Net income Dividends Ending balance Forecast 2020 n/a $ 216,115.0 n/a n/a n/a $ 216,115.0 Forecast Forecast Forecast Forecast 2024 2021 2022 2023 n/a $ 166,181.4 $ 196,114.8 $ 227,622.3 $ 260,782.4 $ 295,678.0 n/a 59,866.9 63,014.9 31,507.5 66,320.3 33,160.2 69,791.0 34,895.5 73,435.3 36,717.6 n/a 29,933.4 $ 166,181.4 $ 196,114.8 $ 227,622.3 $ 260,782.4 $ 295,678.0 $ 332,395.6 In comparison to the three industry competitors is WCC more leveraged or less leveraged after the transaction based on 2020 results? 2020 EBIT 2020 Interest Coverage Is it higher or lower than competitors? 2020 Debt 2020 EBITDA Debt/EBITDA Is it higher or lower than competitors? 2020 Debt 2020 Equity D/E Is it higher or lower than competitors?
Expert Answer:
Answer rating: 100% (QA)
WCC Financials Revenue and Fixed Assets and Equity 5year Forecast Financials Excel Formulas all others are already given from the above assumptions Re... View the full answer

Related Book For 
Fundamental Managerial Accounting Concepts
ISBN: 978-1259569197
8th edition
Authors: Thomas Edmonds, Christopher Edmonds, Bor Yi Tsay, Philip Olds
Posted Date:
Students also viewed these accounting questions
-
1. Consider a two-ray channel with impulse response h(t) = 8(t) + 8(t 0.022s). Find the distance separating the transmitter and receiver, as well as and , assuming free-space path loss on each path...
-
2. A ball B has a mass of m=0.5 kg and is at- tached to a cord which passes through a hole 4 in a smooth table. When the ball is r= 400 mm from the hole, it is rotating around the hole in a circle...
-
Income statement 2020 Net sales 60,000 Operating expenses excl. depreciation - 55,000 Depreciation - 1,500 Operating profit 3,500 Financial expenses - 1,000 Profit before tax 2,500 Tax -500 Reported...
-
Review how once an IDPS detects an anomalous network situation, it has several options, depending on the policy and objectives of the organization that has configured it as well as the capabilities...
-
Managers need information of all types in order to make decisions. Many marketing decisions are strategic, such as setting pricing policies. Managers rely on multiple sources to help locate relevant...
-
According to the graph below, at what point will reducing your amount of diversifiable risk in a portfolio become very difficult? 49.2% Risk (Portfolio Standard Deviation) 19.2% # of securities in...
-
The area enclosed by a thermodynamic cycle on a \(T-S\) diagram represents the (a) Net work done (b) Net heat interaction (c) Both (a) and (b) (d) Neither (a) nor (b).
-
Ford executives announced that the company would extend its most dramatic consumer incentive program in the companys long historythe Ford Drive America Program. The program provides consumers with...
-
The direct labor budget of Yuvwell Corporation for the upcoming fiscal year contains the following details concerning budgeted direct labor-hours: Budgeted direct labor-hours 1st Quarter 8,800 2nd...
-
Budget Performance Reports for Cost Centers Partially completed budget performance reports for Delmar Company, a manufacturer of light duty motors, follow: Delmar Company Budget Performance...
-
Create an application that simulates transactions for a bank / financial checking or savings account. Your application is to request account holder information ( refer to the sample program...
-
Arithmetic versus geometric average. (a) Let a 1 , a 2 > 0 a 1 , a 2 > 0 and show that a 1 + a 2 2 a 1 a 2 a 1 + a 2 2 a 1 a 2 (b) Use Jensen's inequality applied to the log function to show that...
-
Infections Can Lower IQ A headline in June 2015 proclaims "Infections can lower IQ." The headline is based on a study in which scientists gave an IQ test to Danish men at age 19. They also analyzed...
-
The chapter provides sample goals for an initial sales call on a prospect. (a) What other goals can you come up with that might be appropriate for an initial sales call? (b) Develop three or four...
-
There were 970 movies made in Hollywood between 2007 and 2013. Suppose that, for a documentary about Hollywood film crews, a random sample of 5 of these movies will be selected for in-depth...
-
An immersion heater operating at \(1000 \mathrm{~W}\) is in the form of a rectangular solid with dimensions of \(16 \mathrm{~cm}\) by \(10 \mathrm{~cm}\) by \(1 \mathrm{~cm}\). Determine the heat...
-
Explain the historical significance of nuclear weapons and explain which countries have them, have tested them or have used them in war. Do you think this is still a threat today?
-
1. Use these cost, revenue, and probability estimates along with the decision tree to identify the best decision strategy for Trendy's Pies. 2. Suppose that Trendy is concerned about her probability...
-
Fulton Fruit Basket Company makes baskets of assorted fruit. The standard and actual costs of oranges used in each basket of fruit follow: ____________________________________________________...
-
Norita Company makes and sells a toy plane. Norita incurred the following costs in its most recent fiscal year: Cost Items Reported on Income Statement Shipping and handling costs ($0.75 per unit)...
-
Ender Phones, Inc. makes telephones that it sells to department stores throughout the United States. Ender is trying to decide which of two telephone models to manufacture. The company could produce...
-
Derive the equations of motion, using Newton's second law of motion, for each of the systems shown in Figs. 6.22. M, cos wt G 15 G3 13 ka 03 4 kn 12 G k3 16 G6 G Number of teeth on gear G, n, (i = 1...
-
Derive the equations of motion, using Newton's second law of motion, for each of the systems shown in Figs. 6.21. Pulley, mass M, mass moment of inertia Jo 3r 3m T x(1) F(t) 2k 000 T x2(1) m T X3(1)...
-
A simplified vibration analysis of an airplane considers bounce and pitch motions (Fig. 6.24(a)). For this, a model consisting of a rigid bar (corresponding to the body of the airplane) supported on...

Study smarter with the SolutionInn App