

Question: WCLN.ca Physics: Energy 2. Plot the three energy graphs below. For the purpose of this activity you may assume that the skater reaches the bottom
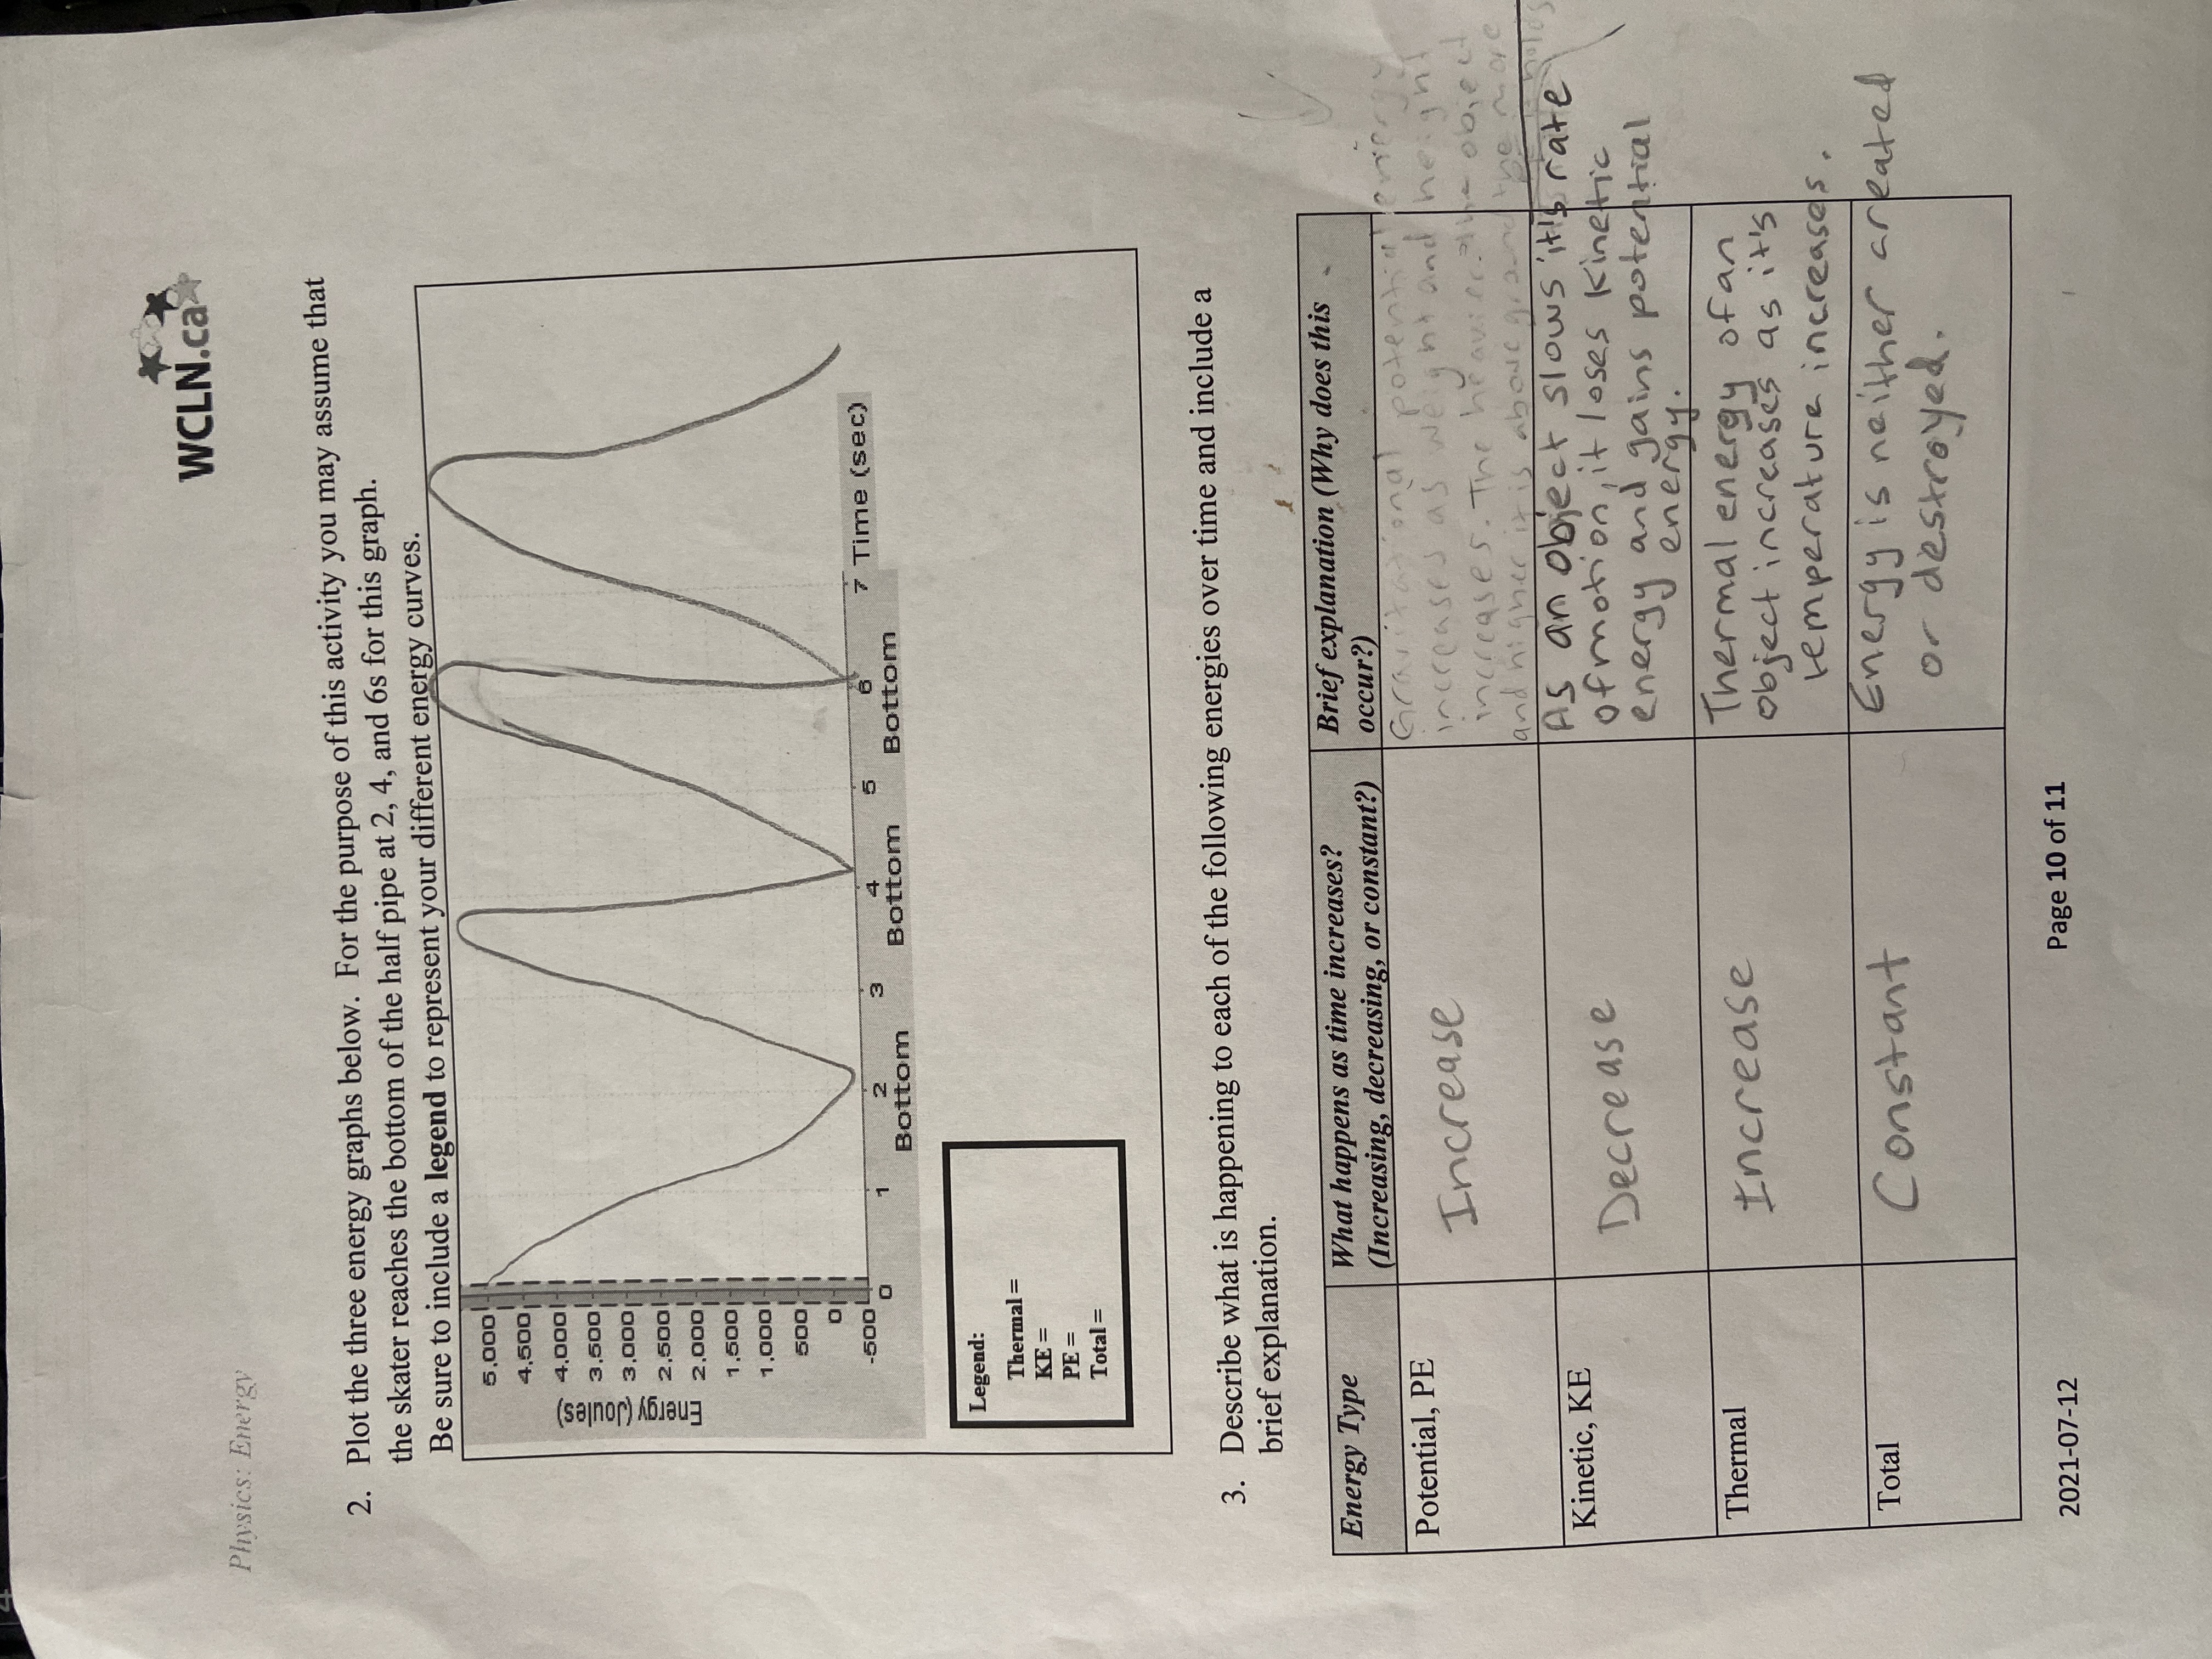
WCLN.ca Physics: Energy 2. Plot the three energy graphs below. For the purpose of this activity you may assume that the skater reaches the bottom of the half pipe at 2, 4, and 6s for this graph. Be sure to include a legend to represent your different energy curves. 5.000 4.500 4.000 3.500 Energy (Joules 3,000 2.500 2.000 1.500 1.000- 500 -500 1 3 6' 7 Time (sec) Bottom Bottom Bottom Legend: Thermal = KE = PE = Total = 3. Describe what is happening to each of the following energies over time and include a brief explanation. Energy Type What happens as time increases? Brief explanation (Why does this (Increasing, decreasing, or constant?) occur?) Potential, PE and potential Increase increases as weight and / height increases. The heavieral- object and higher it is the more Kinetic, KE As an object slows it's rate Decrease ofmotion, it loses Kinetic energy and gains potential energy . Thermal Increase Thermal energy of an object increases as it's temperature increases. Total Constant Energy is neither created or destroyed. 2021-07-12 Page 10 of 11
Step by Step Solution
There are 3 Steps involved in it

Get step-by-step solutions from verified subject matter experts