

Question: We are evaluating a project that costs $845,000, has an eight-year life, and has no salvage value. Assume that depreciation is straight-line to zero over
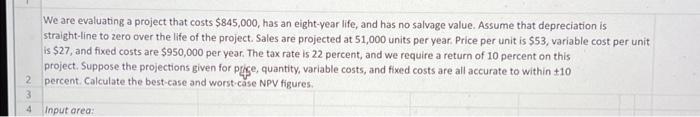
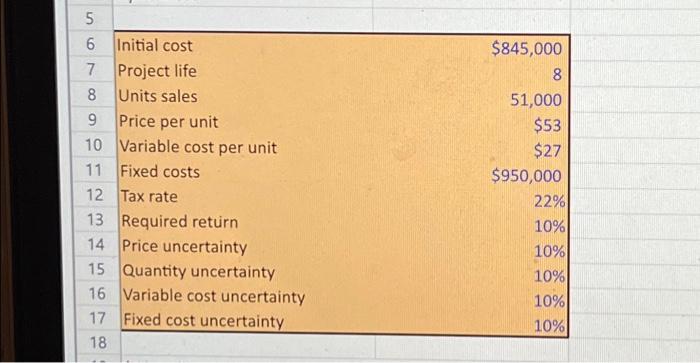
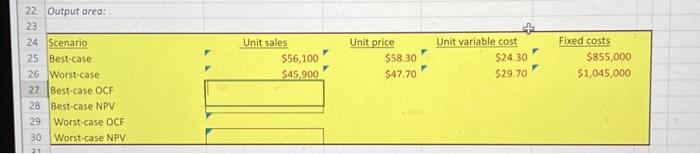
We are evaluating a project that costs $845,000, has an eight-year life, and has no salvage value. Assume that depreciation is straight-line to zero over the life of the project. Sales are projected at 51,000 units per year. Price per unit is $53, variable cost per unit is $27, and fixed costs are $950,000 per year. The tax rate is 22 percent, and we require a return of 10 percent on this project. Suppose the projections given for pice, quantity, variable costs, and fixed costs are all accurate to within +10 percent. Calculate the best-case and worst-ase NPV figures. \begin{tabular}{|c|lr|} \hline 5 & & \\ \hline 6 & Initial cost & $845,000 \\ \hline 7 & Project life & 8 \\ \hline 8 & Units sales & 51,000 \\ \hline 9 & Price per unit & $53 \\ \hline 10 & Variable cost per unit & $27 \\ \hline 11 & Fixed costs & $950,000 \\ \hline 12 & Tax rate & 22% \\ 13 & Required return & 10% \\ \hline 14 & Price uncertainty & 10% \\ \hline 15 & Quantity uncertainty & 10% \\ \hline 16 & Variable cost uncertainty & 10% \\ \hline 17 & Fixed cost uncertainty & 10% \\ \hline 18 & & \end{tabular} 22 Output area: We are evaluating a project that costs $845,000, has an eight-year life, and has no salvage value. Assume that depreciation is straight-line to zero over the life of the project. Sales are projected at 51,000 units per year. Price per unit is $53, variable cost per unit is $27, and fixed costs are $950,000 per year. The tax rate is 22 percent, and we require a return of 10 percent on this project. Suppose the projections given for pice, quantity, variable costs, and fixed costs are all accurate to within +10 percent. Calculate the best-case and worst-ase NPV figures. \begin{tabular}{|c|lr|} \hline 5 & & \\ \hline 6 & Initial cost & $845,000 \\ \hline 7 & Project life & 8 \\ \hline 8 & Units sales & 51,000 \\ \hline 9 & Price per unit & $53 \\ \hline 10 & Variable cost per unit & $27 \\ \hline 11 & Fixed costs & $950,000 \\ \hline 12 & Tax rate & 22% \\ 13 & Required return & 10% \\ \hline 14 & Price uncertainty & 10% \\ \hline 15 & Quantity uncertainty & 10% \\ \hline 16 & Variable cost uncertainty & 10% \\ \hline 17 & Fixed cost uncertainty & 10% \\ \hline 18 & & \end{tabular} 22 Output area
Step by Step Solution
There are 3 Steps involved in it

Get step-by-step solutions from verified subject matter experts