

Question: We are interested in modeling the effect that BMI and CHOL have on HCHOL. BMI CHOL HCHOL Healthy weight 121.360714919185 44.4438970561993 Overweight 78.7291252018089 36.3604381686569 Overweight
We are interested in modeling the effect that BMI and CHOL have on HCHOL.
"BMI" "CHOL" "HCHOL" "Healthy weight" 121.360714919185 44.4438970561993 "Overweight" 78.7291252018089 36.3604381686569 "Overweight" 107.757549119412 67.3946394315661 "Healthy weight" 110.904533745607 44.1070827589113 "Healthy weight" 139.581051261013 55.6010287288078 "Overweight" 120.945327804865 63.7621963753986 "Overweight" 113.044820605812 74.3130552358821 "Healthy weight" 83.3126605973416 55.3302201843636 "Overweight" 144.515999868312 89.3895656996032 "Healthy weight" 125.035139373654 47.0247854442376 "Overweight" 126.035871092881 66.3969920510274 "Overweight" 106.214349180383 56.2748456375253 "Healthy weight" 128.411632135097 53.2297291977335 "Healthy weight" 104.080179360128 29.8630967789898 "Overweight" 122.84903417701 68.7624132160907 "Healthy weight" 102.681955827792 38.4247315330522 "Overweight" 143.830304238539 62.2488064591591 "Overweight" 107.86846174533 61.9392644264275 "Overweight" 151.788597262037 82.5599992853383 "Overweight" 129.946881343367 61.9110568864794 "Overweight" 137.572008433033 63.4923436692696 "Healthy weight" 103.655233709297 52.4593115007215 "Overweight" 149.003169227611 88.8513904334373 "Overweight" 137.469279799946 76.3829506183296 "Overweight" 146.789264672702 64.276865873935 "Healthy weight" 140.279608166675 58.1792611098729 "Overweight" 134.028910103872 75.2067444515841 "Healthy weight" 138.337907201538 43.2704976737514 "Overweight" 104.851368842692 62.1986217437354
(b) Using the confidence interval from part a, answer the following:
There is / is not a significant difference between the slopes of healthy and overweight individuals for the separate lines model.
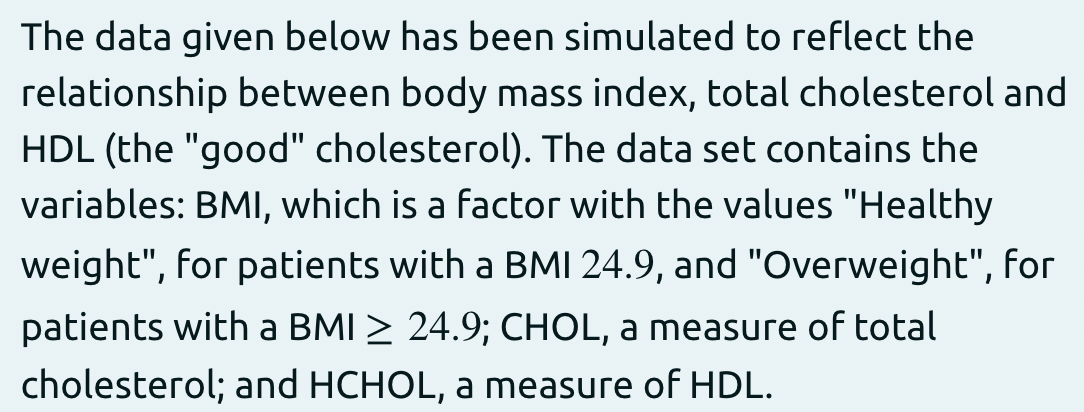
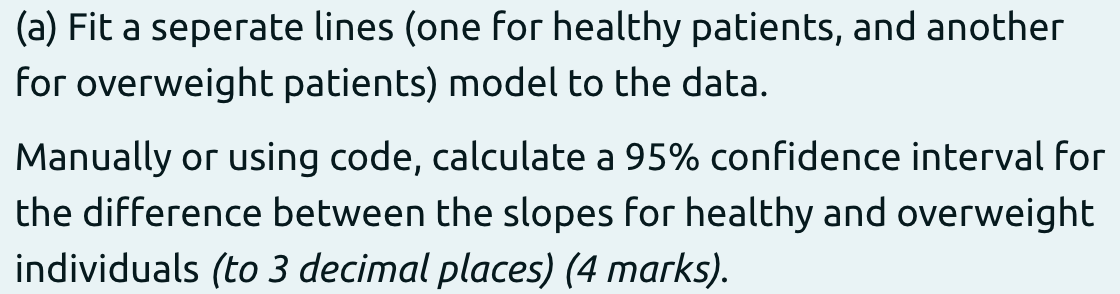
The data given below has been simulated to reflect the relationship between body mass index, total cholesterol and HDL (the "good" cholesterol). The data set contains the variables: BMI, which is a factor with the values "Healthy weight", for patients with a BMI 24.9, and "Overweight", for patients with a BMI > 24.9; CHOL, a measure of total cholesterol; and HCHOL, a measure of HDL. (a) Fit a seperate lines (one for healthy patients, and another for overweight patients) model to the data. Manually or using code, calculate a 95% confidence interval for the difference between the slopes for healthy and overweight individuals (to 3 decimal places) (4 marks). The data given below has been simulated to reflect the relationship between body mass index, total cholesterol and HDL (the "good" cholesterol). The data set contains the variables: BMI, which is a factor with the values "Healthy weight", for patients with a BMI 24.9, and "Overweight", for patients with a BMI > 24.9; CHOL, a measure of total cholesterol; and HCHOL, a measure of HDL. (a) Fit a seperate lines (one for healthy patients, and another for overweight patients) model to the data. Manually or using code, calculate a 95% confidence interval for the difference between the slopes for healthy and overweight individuals (to 3 decimal places) (4 marks)
Step by Step Solution
There are 3 Steps involved in it

Get step-by-step solutions from verified subject matter experts