

Question: We are learning multiples in class. I need help with the calculations for the highlighted portions that are uncompleted. When I attempt them I get
We are learning multiples in class. I need help with the calculations for the highlighted portions that are uncompleted. When I attempt them I get numbers that do not make sense. Please help.
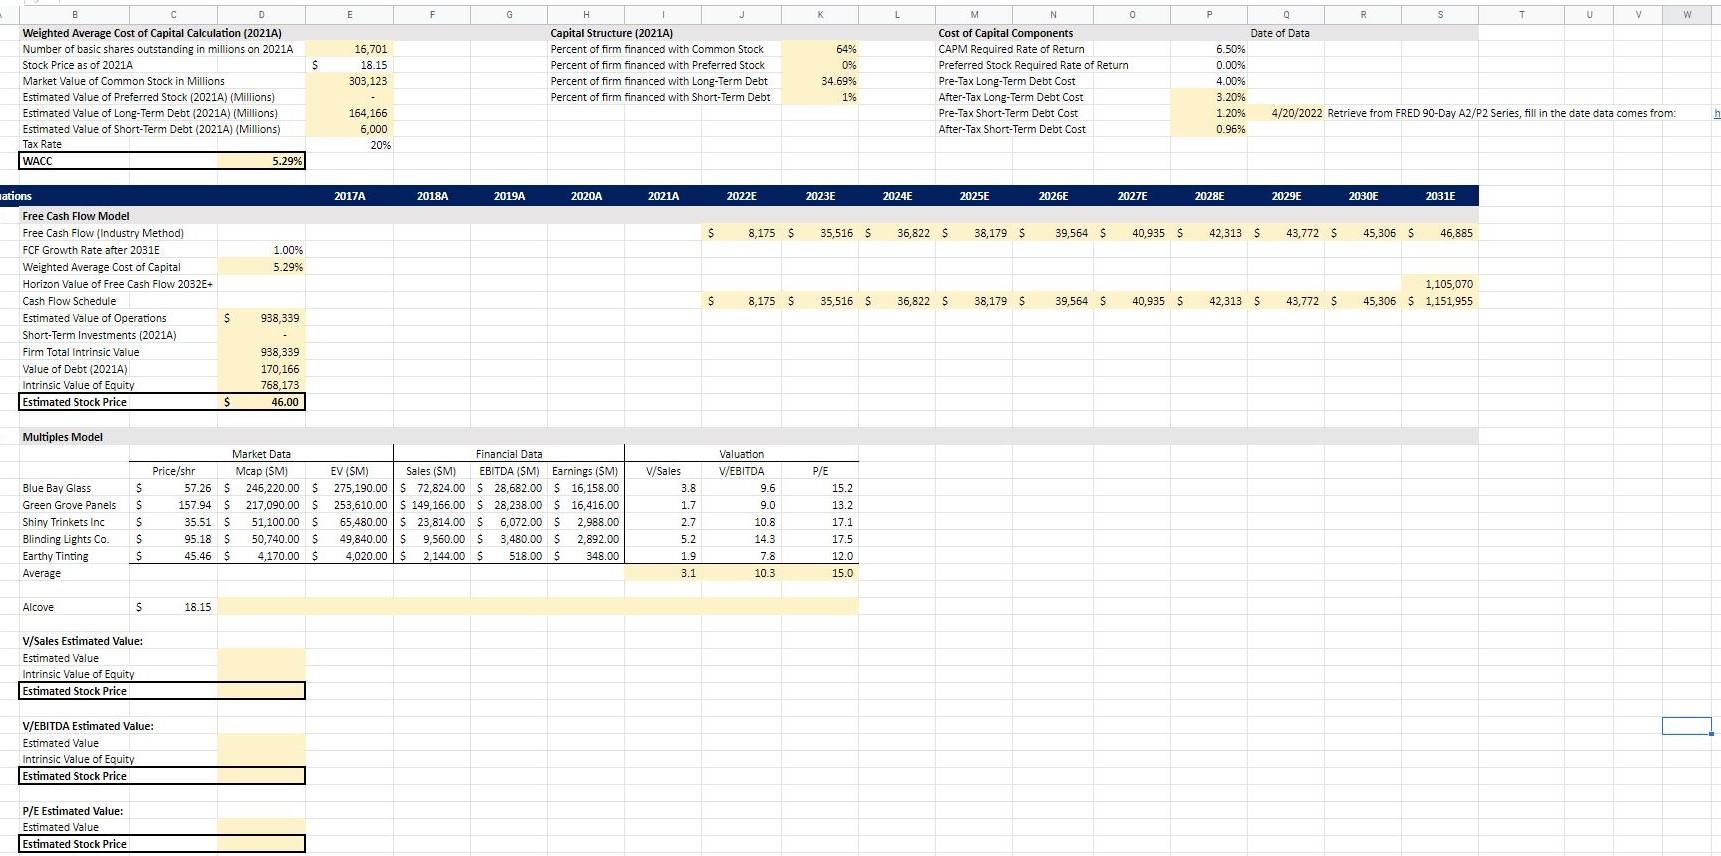
D G H 1 V W B Weighted Average Cost of Capital Calculation (2021A) Number of basic shares outstanding millions on 2021A Stock Price as of 2021A Market Value of Common Stock in Millions Estimated Value of Preferred Stock (2021A) (Millions) Estimated Value of Long-Term Debt (2021A) (Millions) Estimated Value of Short-Term Debt (2021A) (Millions) Tax Rate WACC 5.29% P 0 Date of Data 6.50% 0.00% Capital Structure (2021A) Percent of firm financed with Common Stock Percent of firm financed with Preferred Stock Percent of firm financed with Long-Term Debt Percent of firm financed with Short-Term Debt 16,701 18.15 303,123 64% 0% 34.69% 1% M N 0 Cost of Capital Components CAPM Required Rate of Return Preferred Stock Required Rate of Return Pre-Tax Long-Term Debt Cost After-Tax Long-Term Debt Cost Pre-Tax Short-Term Debt Cost After-Tax Short-Term Debt Cost 4.00% 3.20% 1.20% 0.96% 4/20/2022 Retrieve from FRED 90-Day A2/P2 Series, fill in the date data comes from: 164, 166 6.000 20% h 2017A 2018A 2019A 2020A 2021A 2022 2023E 2024E 2025E 2026E 2027E 2028E 2029E 2030E 2031E $ 8,175 $ 35,516 $ 36,822 $ 38,179 $ 39,564 $ 40,9355 42,313 $ 43,772 $ 45,306 $ 46,885 1.00% 5.29% ations Free Cash Flow Model Free Cash Flow (Industry Method) FCF Growth Rate after 2031E Weighted Average Cost of Capital Horizon Value of Free Cash Flow 2032E+ Cash Flow Schedule Estimated Value of Operations Short-Term Investments (2021A) Firm Total Intrinsic Value Value of Debt (2021A) Intrinsic Value of Equity Estimated Stock Price 1,105,070 45,306 $ 1,151,955 $ 8,175 $ 35,516 $ 36,822 $ 38,179 $ 39,564 $ 40,935 $ 42,313 $ 43,772 $ $ 938,339 938,339 170,166 768,173 46.00 $ Multiples Model V/Sales 3.8 Blue Bay Glass Green Grove Panels Shiny Trinkets Inc Blinding Lights Co. Earthy Tinting Average S S $ $ S Market Data Price/shr Mcap (SM) 57.26 $ 246,220.00 $ 157.94 $ 217,090.00 $ 35.51 $ 51,100.00 $ 95.18 S 50,740.00 $ 45.46 $ 4,170.00 $ Financial Data EV (SM) Sales (SM) EBITDA (SM) Earnings (SM) 275,190.00 $ 72,824.00 $ 28,682.00 $ 16,158.00 253,610.00 $ 149,166.00 $ 28,238.00 $ 16,416.00 65,480.00 $ 23,814.00 $ 6,072.00 $ 2.988.00 49,840.00 $ 9,560.00 $ 3,480.00 $ 2.892.00 4,020.00 s 2,144.00 $ 518.00 S 348.00 1.7 2.7 5.2 1.9 3.1 Valuation V/EBITDA 9.6 9.0 10.8 14.3 7.8 10.3 P/E 15.2 13.2 17.1 17.5 12.0 15.0 Alcove S 18.15 V/Sales Estimated Value: Estimated Value Intrinsic Value of Equity Estimated Stock Price V/EBITDA Estimated Value: Estimated Value Intrinsic Value of Equity Estimated Stock Price P/E Estimated Value: Estimated Value Estimated Stock Price D G H 1 V W B Weighted Average Cost of Capital Calculation (2021A) Number of basic shares outstanding millions on 2021A Stock Price as of 2021A Market Value of Common Stock in Millions Estimated Value of Preferred Stock (2021A) (Millions) Estimated Value of Long-Term Debt (2021A) (Millions) Estimated Value of Short-Term Debt (2021A) (Millions) Tax Rate WACC 5.29% P 0 Date of Data 6.50% 0.00% Capital Structure (2021A) Percent of firm financed with Common Stock Percent of firm financed with Preferred Stock Percent of firm financed with Long-Term Debt Percent of firm financed with Short-Term Debt 16,701 18.15 303,123 64% 0% 34.69% 1% M N 0 Cost of Capital Components CAPM Required Rate of Return Preferred Stock Required Rate of Return Pre-Tax Long-Term Debt Cost After-Tax Long-Term Debt Cost Pre-Tax Short-Term Debt Cost After-Tax Short-Term Debt Cost 4.00% 3.20% 1.20% 0.96% 4/20/2022 Retrieve from FRED 90-Day A2/P2 Series, fill in the date data comes from: 164, 166 6.000 20% h 2017A 2018A 2019A 2020A 2021A 2022 2023E 2024E 2025E 2026E 2027E 2028E 2029E 2030E 2031E $ 8,175 $ 35,516 $ 36,822 $ 38,179 $ 39,564 $ 40,9355 42,313 $ 43,772 $ 45,306 $ 46,885 1.00% 5.29% ations Free Cash Flow Model Free Cash Flow (Industry Method) FCF Growth Rate after 2031E Weighted Average Cost of Capital Horizon Value of Free Cash Flow 2032E+ Cash Flow Schedule Estimated Value of Operations Short-Term Investments (2021A) Firm Total Intrinsic Value Value of Debt (2021A) Intrinsic Value of Equity Estimated Stock Price 1,105,070 45,306 $ 1,151,955 $ 8,175 $ 35,516 $ 36,822 $ 38,179 $ 39,564 $ 40,935 $ 42,313 $ 43,772 $ $ 938,339 938,339 170,166 768,173 46.00 $ Multiples Model V/Sales 3.8 Blue Bay Glass Green Grove Panels Shiny Trinkets Inc Blinding Lights Co. Earthy Tinting Average S S $ $ S Market Data Price/shr Mcap (SM) 57.26 $ 246,220.00 $ 157.94 $ 217,090.00 $ 35.51 $ 51,100.00 $ 95.18 S 50,740.00 $ 45.46 $ 4,170.00 $ Financial Data EV (SM) Sales (SM) EBITDA (SM) Earnings (SM) 275,190.00 $ 72,824.00 $ 28,682.00 $ 16,158.00 253,610.00 $ 149,166.00 $ 28,238.00 $ 16,416.00 65,480.00 $ 23,814.00 $ 6,072.00 $ 2.988.00 49,840.00 $ 9,560.00 $ 3,480.00 $ 2.892.00 4,020.00 s 2,144.00 $ 518.00 S 348.00 1.7 2.7 5.2 1.9 3.1 Valuation V/EBITDA 9.6 9.0 10.8 14.3 7.8 10.3 P/E 15.2 13.2 17.1 17.5 12.0 15.0 Alcove S 18.15 V/Sales Estimated Value: Estimated Value Intrinsic Value of Equity Estimated Stock Price V/EBITDA Estimated Value: Estimated Value Intrinsic Value of Equity Estimated Stock Price P/E Estimated Value: Estimated Value Estimated Stock Price
Step by Step Solution
There are 3 Steps involved in it

Get step-by-step solutions from verified subject matter experts