

Question: we are using python temp.zip pictures are attached under this For this lab, please put all functions into a file named Lab_ 8X.py (where X
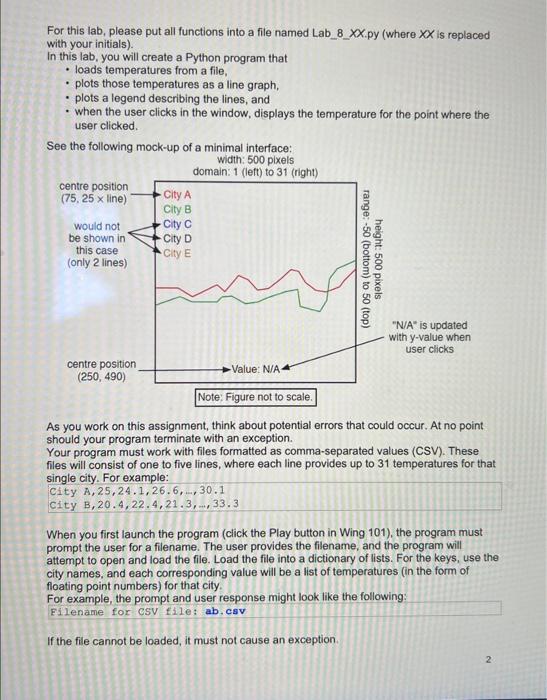
For this lab, please put all functions into a file named Lab_ 8X.py (where X is replaced with your initials). In this lab, you will create a Python program that - loads temperatures from a file, - plots those temperatures as a line graph, - plots a legend describing the lines, and - when the user clicks in the window, displays the temperature for the point where the user clicked. As you work on this assignment, think about potential errors that could occur. At no point should your program terminate with an exception. Your program must work with files formatted as comma-separated values (CSV). These files will consist of one to five lines, where each line provides up to 31 temperatures for that single city. For example: City A,25,24.1,26.6,,30.1 City B,20.4,22.4,21.3,,33.3 When you first launch the program (click the Play button in Wing 101), the program must prompt the user for a filename. The user provides the filename, and the program will attempt to open and load the file. Load the file into a dictionary of lists. For the keys, use the city names, and each corresponding value will be a list of temperatures (in the form of floating point numbers) for that city. For example, the prompt and user response might look like the following: Filename for CSV file: ab,csv After loading in the available data, the program creates a plot of the data in a 500500 pixel window. The domain of this plot is 1 to 31 (inclusive), and the range is -50 to 50 (inclusive). For each city from the data file, the plot must contain one line (consisting of multiple graphics.py Line objects). Each line must appear in a different colour. Recommended colours: "red", "green", "blue", "black", and "orange". The plot must also include a brief legend in the top-left corner: each city name must appear in the same colour as the line. At the bottom of the plot, the text Value: N/A initially appears. The window must allow the user to click multiple times within it. When the user clicks at a point, the label at the bottom must be updated to reflect the location ( y-value) of the click, e.g. Value: 24.23. The floating-point value should be rounded to two decimal places. When the user closes the window, it must not cause an exception. The csv files must be saved in a folder named temps. Therefore, when opening the file, "temps/" must be added in front of the file name. Hint - the GraphWin method toworld (...) may help you place Text objects after you've called the method setcoords (...)
Step by Step Solution
There are 3 Steps involved in it

Get step-by-step solutions from verified subject matter experts