

Question: 1. Do you notice any unusually large deviations in the graph? Can you tell if these deviations are due to chance just by looking? 2.
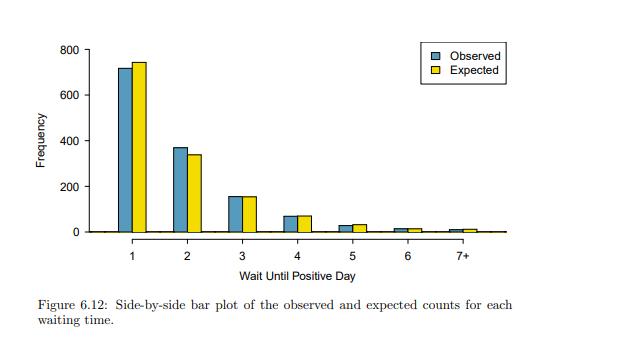
1. Do you notice any unusually large deviations in the graph? Can you tell if these deviations are due to chance just by looking?
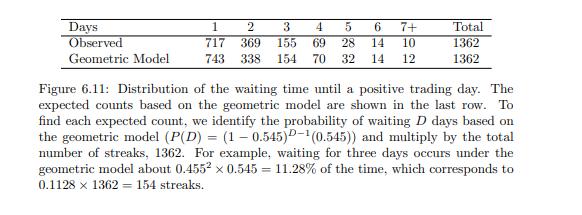
2. Figure 6.11 provides a set of count data for waiting times (O1 = 717, O2 = 369, ...) and expected counts under the geometric distribution (E1 = 743, E2 = 338, ...). Compute the chi-square test statistic, X2 .
3. Because the expected counts are all at least 5, we can safely apply the chi-square distribution to X2 . However, how many degrees of freedom should we use?
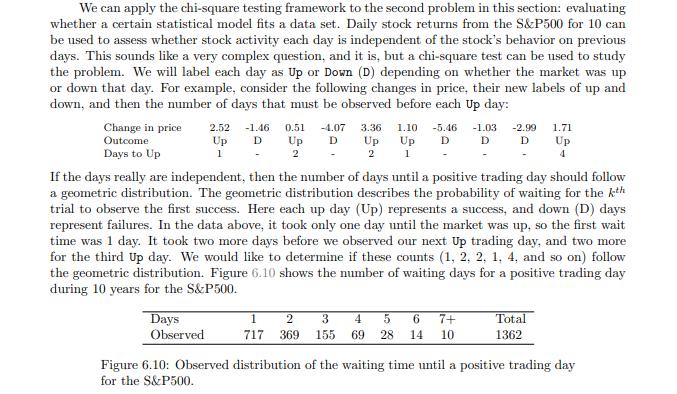
We can apply the chi-square testing framework to the second problem in this section: evaluating whether a certain statistical model fits a data set. Daily stock returns from the S&P500 for 10 can be used to assess whether stock activity each day is independent of the stock's behavior on previous days. This sounds like a very complex question, and it is, but a chi-square test can be used to study the problem. We will label each day as Up or Down (D) depending on whether the market was up or down that day. For example, consider the following changes in price, their new labels of up and down, and then the number of days that must be observed before each Up day: Change in price Outcome 1 - 2.52 -1.46 0.51 -4.07 3.36 Up D Up D Up 2 - 2 1.10 -5.46 -1.03 -2.99 Up D D D 1 1.71 Up 4 Days to Up If the days really are independent, then the number of days until a positive trading day should follow a geometric distribution. The geometric distribution describes the probability of waiting for the kth trial to observe the first success. Here each up day (Up) represents a success, and down (D) days represent failures. In the data above, it took only one day until the market was up, so the first wait time was 1 day. It took two more days before we observed our next Up trading day, and two more for the third Up day. We would like to determine if these counts (1, 2, 2, 1, 4, and so on) follow the geometric distribution. Figure 6.10 shows the number of waiting days for a positive trading day during 10 years for the S&P500. Days Observed 1 2 3 717 369 155 4 5 6 7+ 69 28 14 10 Total 1362 Figure 6.10: Observed distribution of the waiting time until a positive trading day for the S&P500.
Step by Step Solution
There are 3 Steps involved in it
1 The graph in Figure 612 sidebyside bar plot shows both observed and expected counts for t... View full answer

Get step-by-step solutions from verified subject matter experts