

Question: We design, develop, manufacture, sell and lease high-performance fully electric vehicles and energy generation and storage systems, and offer services related to our products.

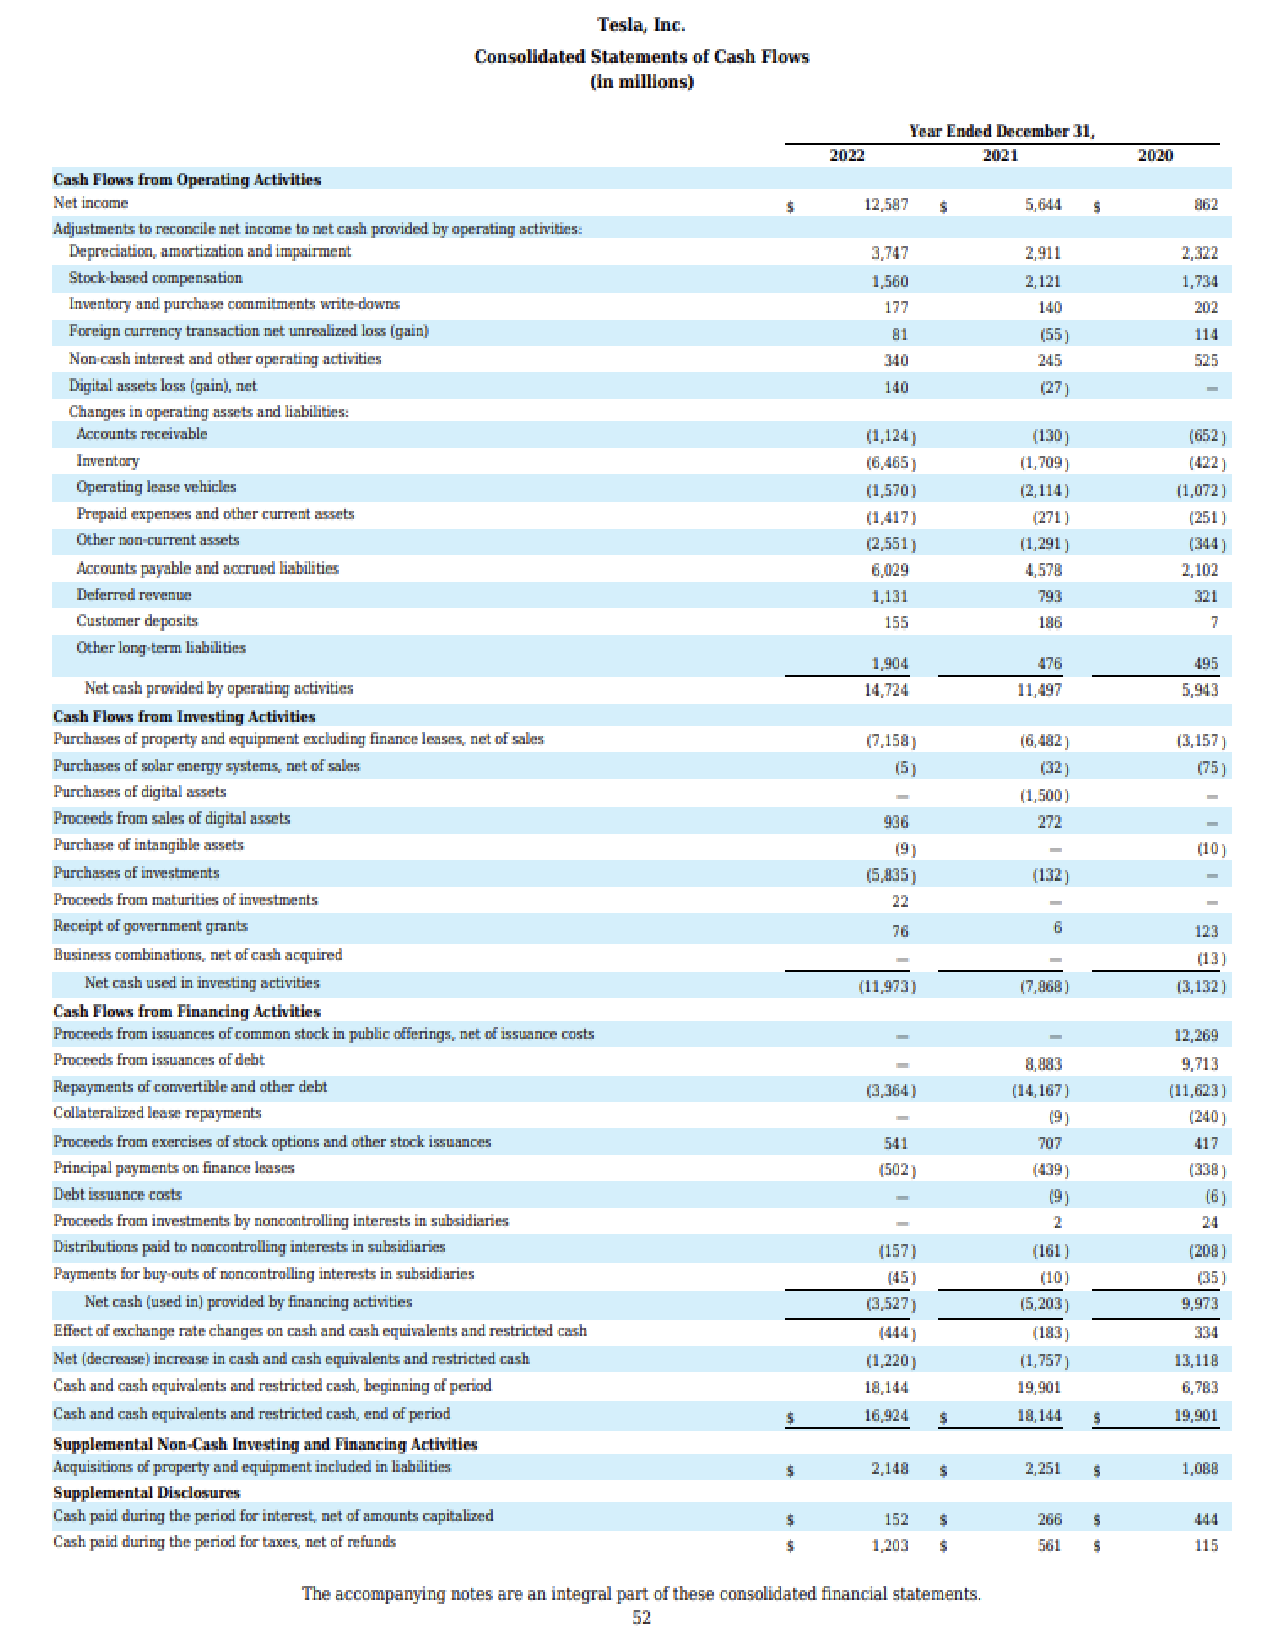
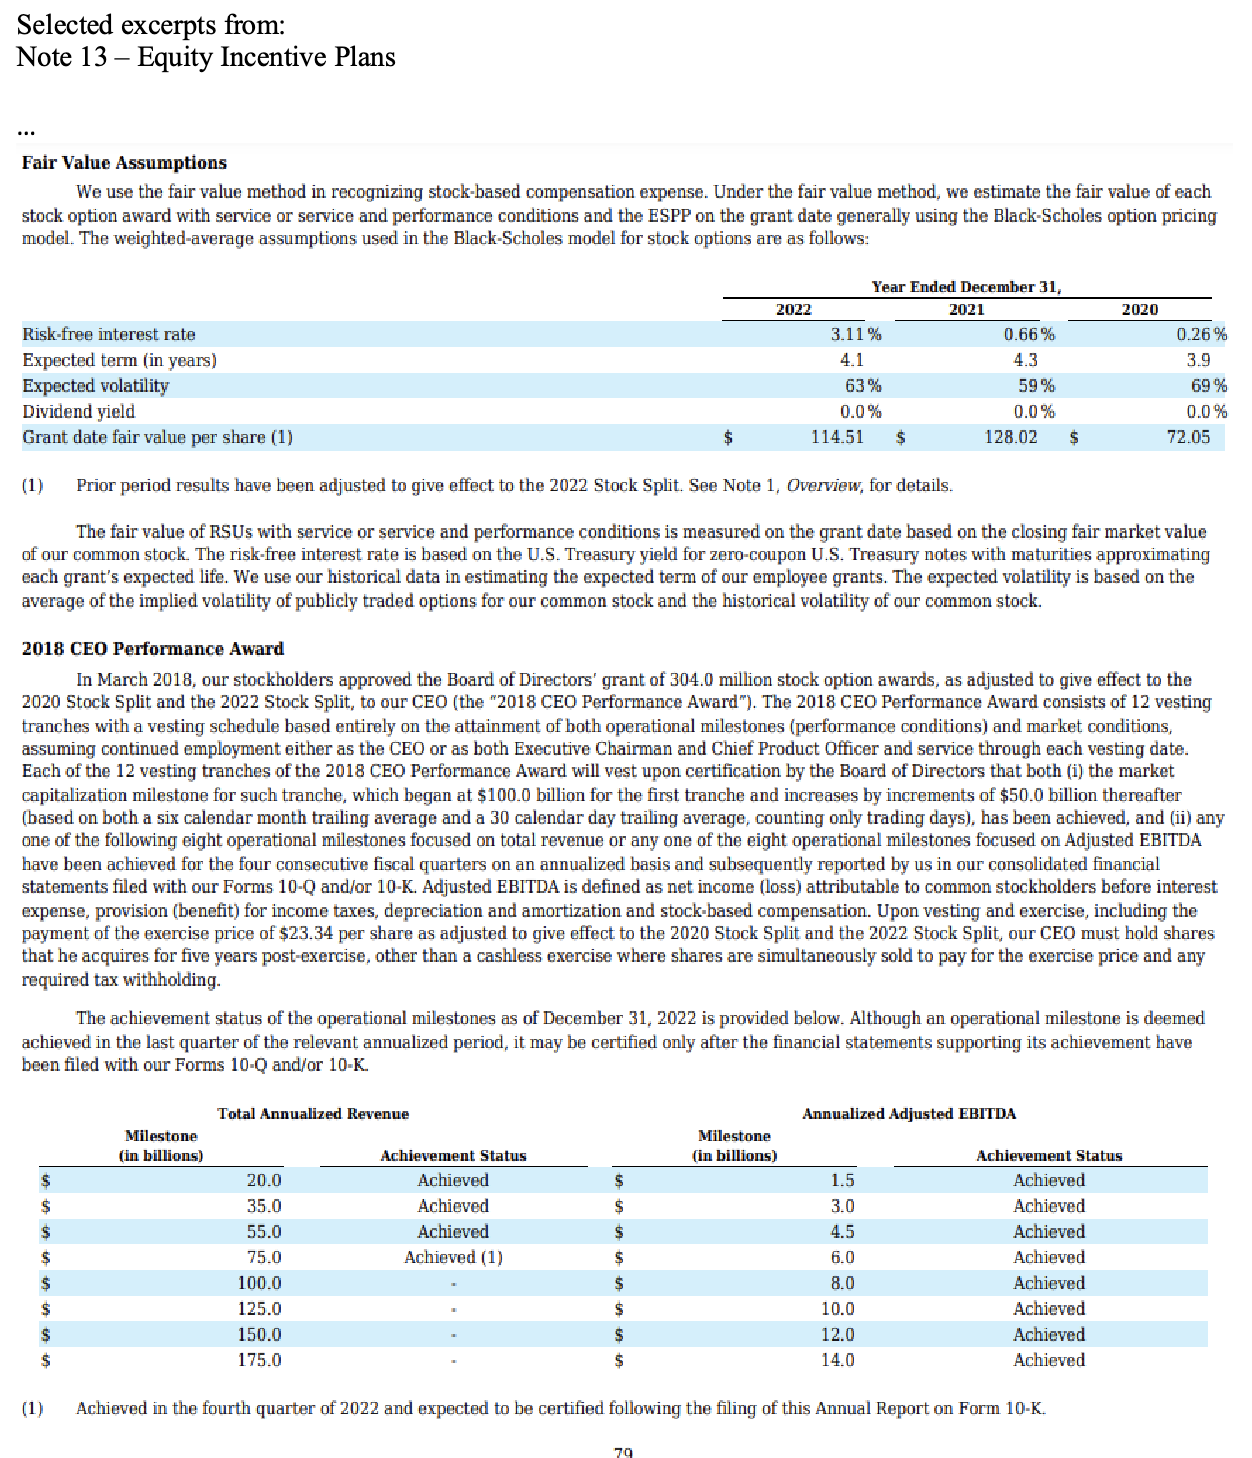
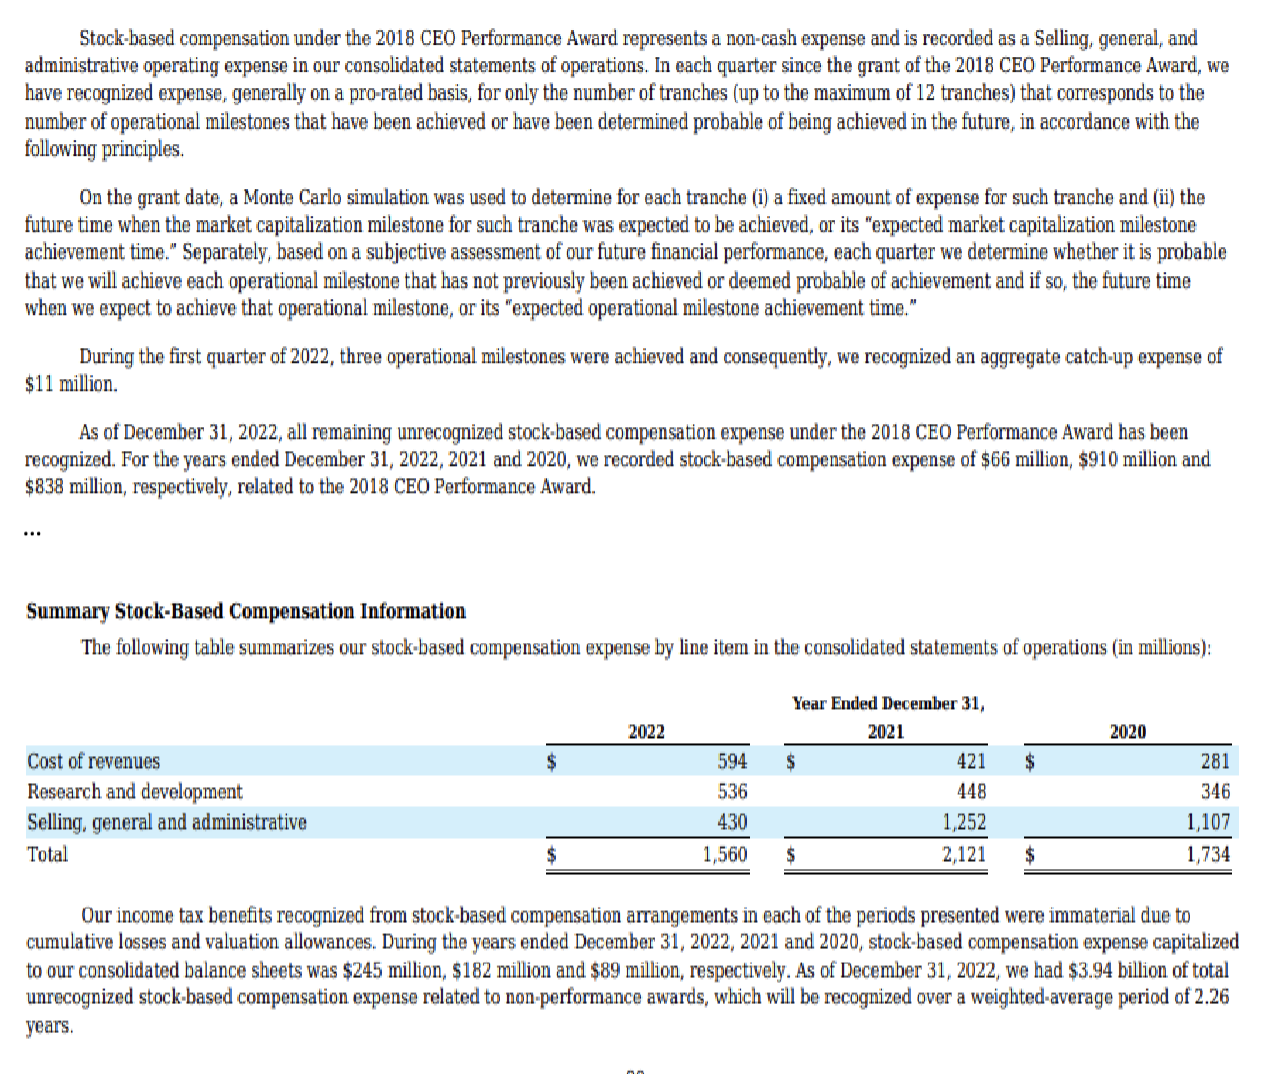
"We design, develop, manufacture, sell and lease high-performance fully electric vehicles and energy generation and storage systems, and offer services related to our products. We generally sell our products directly to customers, and continue to grow our customer-facing infrastructure through a global network of vehicle service centers, Mobile Service, body shops, Supercharger stations and Destination Chargers to accelerate the widespread adoption of our products. We emphasize performance, attractive styling and the safety of our users and workforce in the design and manufacture of our products and are continuing to develop full self-driving technology for improved safety. We also strive to lower the cost of ownership for our customers through continuous efforts to reduce manufacturing costs and by offering financial and other services tailored to our products..." Tesla's 2022 Consolidated Statement of Cash Flows and selected excerpts from "Note 13 - Equity Incentive Plans" are shown following the REQUIRED, below. Both of these items are from the company's audited financial statements for the year ended December 31, 2022. REQUIRED: (a) Is Tesla's "Stock-based compensation" expense material? Explain. (3 marks) (b) Evaluate the quality of the excerpts from Note 13. (10 marks) Tesla, Inc. Consolidated Statements of Cash Flows (in millions) Cash Flows from Operating Activities Net income Adjustments to reconcile net income to net cash provided by operating activities: Depreciation, amortization and impairment Stock-based compensation Inventory and purchase commitments write-downs Foreign currency transaction net unrealized loss (gain) Non-cash interest and other operating activities Digital assets loss (gain), net Changes in operating assets and liabilities: Accounts receivable Inventory Operating lease vehicles Prepaid expenses and other current assets Other non-current assets Accounts payable and accrued liabilities Deferred revenue Customer deposits Other long-term liabilities 2022 Year Ended December 31, 2021 12.587 $ 5,644 2020 862 3,747 2,911 2,322 1,560 2,121 1,734 177 140 202 81 (55) 114 340 245 525 140 (27) - (1,124) (130) (652) (6,465) (1,709) (422) (1,570) (2,114) (1,072) (1,417) (271) (251) (2,551) (1,291) (344) 6,029 4,578 2,102 1,131 793 321 155 186 7 1,904 476 495 Net cash provided by operating activities 14,724 11,497 5,943 Cash Flows from Investing Activities Purchases of property and equipment excluding finance leases, net of sales (7,158) (6,482) (3,157) Purchases of solar energy systems, net of sales (5) (32) (75) Purchases of digital assets Proceeds from sales of digital assets 936 (9) (1,500) 272 - - (10) Purchase of intangible assets Purchases of investments Proceeds from maturities of investments Receipt of government grants Business combinations, net of cash acquired (5,835) (132) - 22 - 76 6 123 (13) Net cash used in investing activities (11,973) (7,868) (3,132) Cash Flows from Financing Activities Proceeds from issuances of common stock in public offerings, net of issuance costs Proceeds from issuances of debt Repayments of convertible and other debt (3,364) Collateralized lease repayments - Proceeds from exercises of stock options and other stock issuances Principal payments on finance leases Debt issuance costs Distributions paid to noncontrolling interests in subsidiaries Proceeds from investments by noncontrolling interests in subsidiaries Payments for buy-outs of noncontrolling interests in subsidiaries Net cash (used in) provided by financing activities Effect of exchange rate changes on cash and cash equivalents and restricted cash Net (decrease) increase in cash and cash equivalents and restricted cash Cash and cash equivalents and restricted cash, beginning of period 12,269 9,713 (11,623) (9) (240) 541 707 417 (502) (439) (338) (9) (6) 2 24 (157) (161) (208) (45) (3,527) (10) (5,203) (35) 9,973 (444) (183) (1,220) (1,757) 334 13,118 18,144 19,901 6,783 $ 16,924 $ 18,144 $ 19,901 8,883 (14,167) Cash and cash equivalents and restricted cash, end of period Supplemental Non-Cash Investing and Financing Activities Acquisitions of property and equipment included in liabilities Supplemental Disclosures Cash paid during the period for interest, net of amounts capitalized $ 2,148 $ 2,251 1,088 152 $ 266 444 Cash paid during the period for taxes, net of refunds $ 1,203 $ 561 $ 115 The accompanying notes are an integral part of these consolidated financial statements. 52 Selected excerpts from: Note 13 Equity Incentive Plans ... Fair Value Assumptions We use the fair value method in recognizing stock-based compensation expense. Under the fair value method, we estimate the fair value of each stock option award with service or service and performance conditions and the ESPP on the grant date generally using the Black-Scholes option pricing model. The weighted-average assumptions used in the Black-Scholes model for stock options are as follows: Year Ended December 31, 2022 2021 2020 Risk-free interest rate 3.11% 0.66% 0.26% Expected term (in years) Expected volatility Dividend yield 4.1 4.3 3.9 63% 59% 69% 0.0% 0.0% 0.0% Grant date fair value per share (1) 114.51 $ 128.02 S 72.05 (1) Prior period results have been adjusted to give effect to the 2022 Stock Split. See Note 1, Overview, for details. The fair value of RSUs with service or service and performance conditions is measured on the grant date based on the closing fair market value of our common stock. The risk-free interest rate is based on the U.S. Treasury yield for zero-coupon U.S. Treasury notes with maturities approximating each grant's expected life. We use our historical data in estimating the expected term of our employee grants. The expected volatility is based on the average of the implied volatility of publicly traded options for our common stock and the historical volatility of our common stock. 2018 CEO Performance Award In March 2018, our stockholders approved the Board of Directors' grant of 304.0 million stock option awards, as adjusted to give effect to the 2020 Stock Split and the 2022 Stock Split, to our CEO (the "2018 CEO Performance Award"). The 2018 CEO Performance Award consists of 12 vesting tranches with a vesting schedule based entirely on the attainment of both operational milestones (performance conditions) and market conditions, assuming continued employment either as the CEO or as both Executive Chairman and Chief Product Officer and service through each vesting date. Each of the 12 vesting tranches of the 2018 CEO Performance Award will vest upon certification by the Board of Directors that both (i) the market capitalization milestone for such tranche, which began at $100.0 billion for the first tranche and increases by increments of $50.0 billion thereafter (based on both a six calendar month trailing average and a 30 calendar day trailing average, counting only trading days), has been achieved, and (ii) any one of the following eight operational milestones focused on total revenue or any one of the eight operational milestones focused on Adjusted EBITDA have been achieved for the four consecutive fiscal quarters on an annualized basis and subsequently reported by us in our consolidated financial statements filed with our Forms 10-Q and/or 10-K. Adjusted EBITDA is defined as net income (loss) attributable to common stockholders before interest expense, provision (benefit) for income taxes, depreciation and amortization and stock-based compensation. Upon vesting and exercise, including the payment of the exercise price of $23.34 per share as adjusted to give effect to the 2020 Stock Split and the 2022 Stock Split, our CEO must hold shares that he acquires for five years post-exercise, other than a cashless exercise where shares are simultaneously sold to pay for the exercise price and any required tax withholding. The achievement status of the operational milestones as of December 31, 2022 is provided below. Although an operational milestone is deemed achieved in the last quarter of the relevant annualized period, it may be certified only after the financial statements supporting its achievement have been filed with our Forms 10-Q and/or 10-K. (1) Total Annualized Revenue Annualized Adjusted EBITDA Milestone (in billions) Achievement Status Milestone (in billions) Achievement Status $ $ 20.0 Achieved S 1.5 Achieved 35.0 Achieved $ 3.0 Achieved 55.0 Achieved $ 4.5 Achieved $ 75.0 Achieved (1) $ 6.0 Achieved $ 100.0 $ 8.0 Achieved $ 125.0 $ 10.0 Achieved $ 150.0 $ 12.0 Achieved $ 175.0 $ 14.0 Achieved Achieved in the fourth quarter of 2022 and expected to be certified following the filing of this Annual Report on Form 10-K. 70 Stock-based compensation under the 2018 CEO Performance Award represents a non-cash expense and is recorded as a Selling, general, and administrative operating expense in our consolidated statements of operations. In each quarter since the grant of the 2018 CEO Performance Award, we have recognized expense, generally on a pro-rated basis, for only the number of tranches (up to the maximum of 12 tranches) that corresponds to the number of operational milestones that have been achieved or have been determined probable of being achieved in the future, in accordance with the following principles. On the grant date, a Monte Carlo simulation was used to determine for each tranche (i) a fixed amount of expense for such tranche and (ii) the future time when the market capitalization milestone for such tranche was expected to be achieved, or its "expected market capitalization milestone achievement time." Separately, based on a subjective assessment of our future financial performance, each quarter we determine whether it is probable that we will achieve each operational milestone that has not previously been achieved or deemed probable of achievement and if so, the future time when we expect to achieve that operational milestone, or its "expected operational milestone achievement time." During the first quarter of 2022, three operational milestones were achieved and consequently, we recognized an aggregate catch-up expense of $11 million. As of December 31, 2022, all remaining unrecognized stock-based compensation expense under the 2018 CEO Performance Award has been recognized. For the years ended December 31, 2022, 2021 and 2020, we recorded stock-based compensation expense of $66 million, $910 million and $838 million, respectively, related to the 2018 CEO Performance Award. Summary Stock-Based Compensation Information The following table summarizes our stock-based compensation expense by line item in the consolidated statements of operations (in millions): Cost of revenues Research and development Selling, general and administrative Total $ 2022 594 $ 536 430 1,560 $ Year Ended December 31, 2021 2020 421 $ 281 448 346 1,252 1,107 2,121 $ 1,734 Our income tax benefits recognized from stock-based compensation arrangements in each of the periods presented were immaterial due to cumulative losses and valuation allowances. During the years ended December 31, 2022, 2021 and 2020, stock-based compensation expense capitalized to our consolidated balance sheets was $245 million, $182 million and $89 million, respectively. As of December 31, 2022, we had $3.94 billion of total unrecognized stock-based compensation expense related to non-performance awards, which will be recognized over a weighted-average period of 2.26 years.
Step by Step Solution
There are 3 Steps involved in it

Get step-by-step solutions from verified subject matter experts