

Question: We discussed this image at length in class. Describe the thought experiment that led to its creation along with some of its limitations and implications.
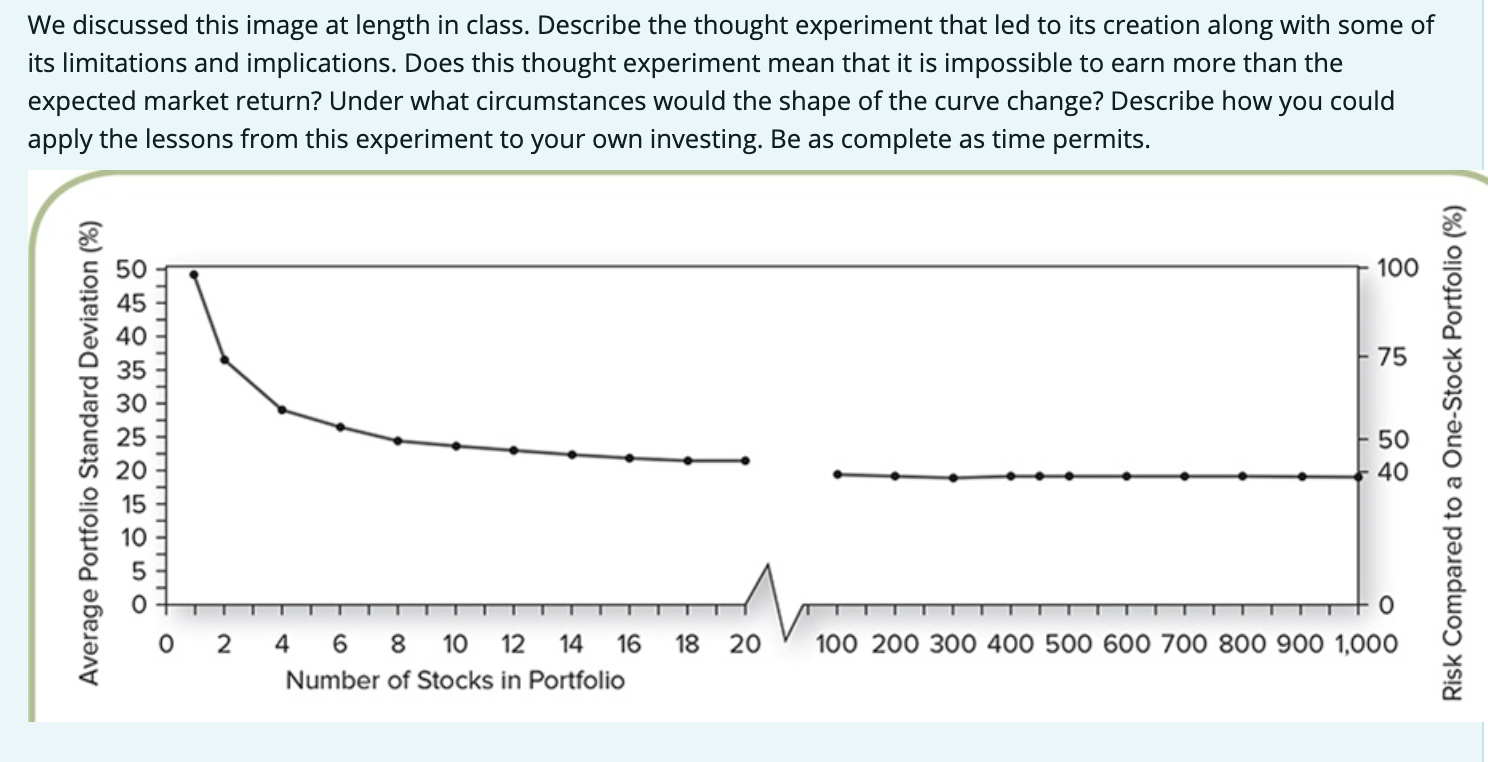
We discussed this image at length in class. Describe the thought experiment that led to its creation along with some of its limitations and implications. Does this thought experiment mean that it is impossible to earn more than the expected market return? Under what circumstances would the shape of the curve change? Describe how you could apply the lessons from this experiment to your own investing. Be as complete as time permits. 100 75 45 40 35 30 25 Average Portfolio Standard Deviation (%) 50 40 Risk Compared to a One-Stock Portfolio (%) 18 20 0 2 4 6 8 10 12 14 16 Number of Stocks in Portfolio +O 100 200 300 400 500 600 700 800 900 1,000 We discussed this image at length in class. Describe the thought experiment that led to its creation along with some of its limitations and implications. Does this thought experiment mean that it is impossible to earn more than the expected market return? Under what circumstances would the shape of the curve change? Describe how you could apply the lessons from this experiment to your own investing. Be as complete as time permits. 100 75 45 40 35 30 25 Average Portfolio Standard Deviation (%) 50 40 Risk Compared to a One-Stock Portfolio (%) 18 20 0 2 4 6 8 10 12 14 16 Number of Stocks in Portfolio +O 100 200 300 400 500 600 700 800 900 1,000
Step by Step Solution
There are 3 Steps involved in it

Get step-by-step solutions from verified subject matter experts