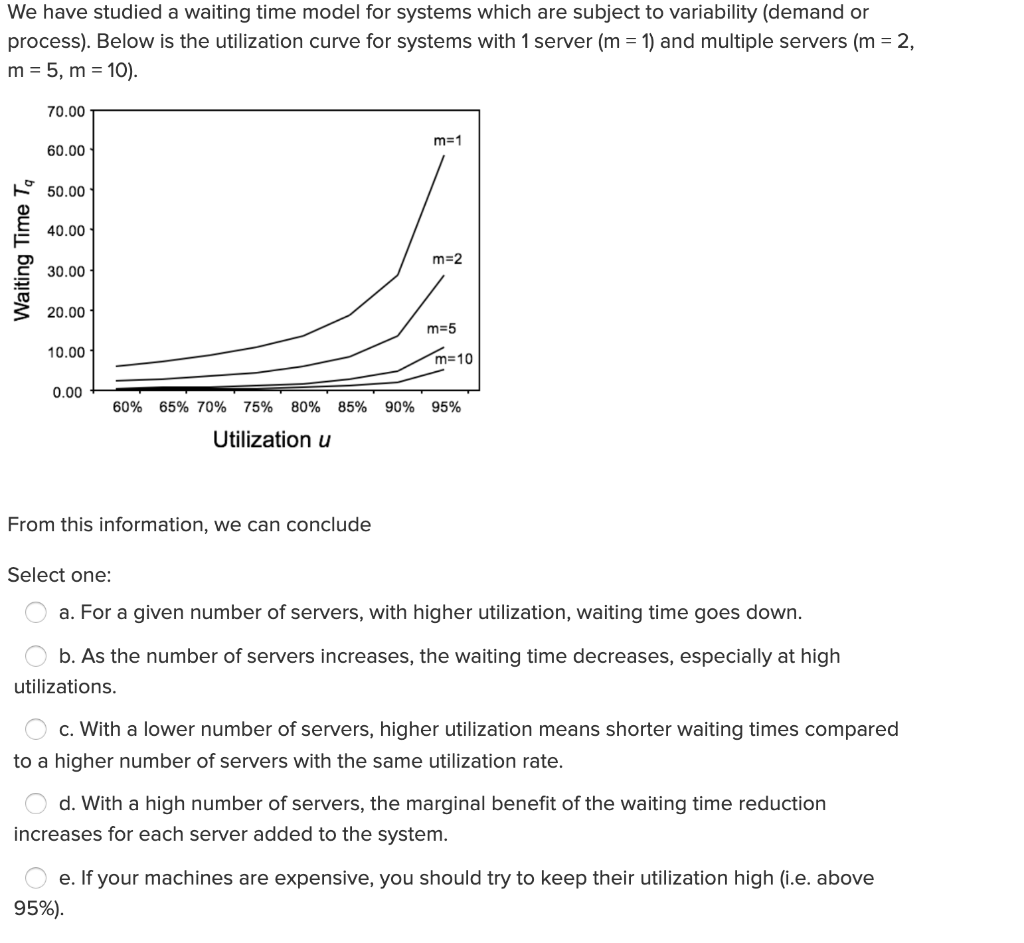
Question: We have studied a waiting time model for systems which are subject to variability (demand or process). Below is the utilization curve for systems with

We have studied a waiting time model for systems

We have studied a waiting time model for systems which are subject to variability (demand or process). Below is the utilization curve for systems with 1 server (m = 1) and multiple servers (m = 2, m = 5, m = 10). 70.00 m =1 60.00 50.00 40.00 Waiting Time To m =2 30.00 20.00 m =5 10.00 m=10 0.00 - 60% 85% 90% 95% 65% 70% 75% 80% Utilization u From this information, we can conclude Select one: O a. For a given number of servers, with higher utilization, waiting time goes down. O b. As the number of servers increases, the waiting time decreases, especially at high utilizations. O c. With a lower number of servers, higher utilization means shorter waiting times compared to a higher number of servers with the same utilization rate. O d. With a high number of servers, the marginal benefit of the waiting time reduction increases for each server added to the system. O e. If your machines are expensive, you should try to keep their utilization high (i.e. above 95%)

Step by Step Solution

There are 3 Steps involved in it

1 Expert Approved Answer
Step: 1 Unlock blur-text-image
Question Has Been Solved by an Expert!

Get step-by-step solutions from verified subject matter experts

Step: 2 Unlock
Step: 3 Unlock

Students Have Also Explored These Related General Management Questions!