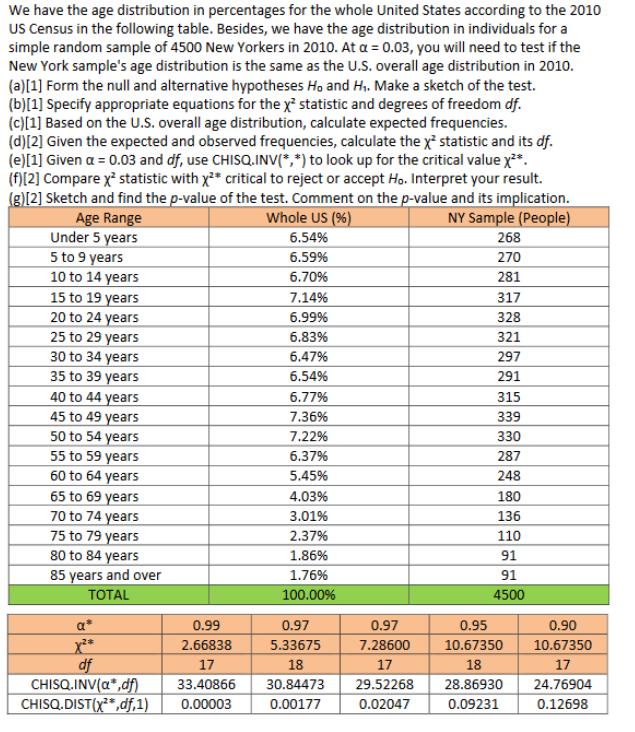
We have the age distribution in percentages for the whole United States according to the 2010...
Fantastic news! We've Found the answer you've been seeking!
Question:
Transcribed Image Text:
We have the age distribution in percentages for the whole United States according to the 2010 US Census in the following table. Besides, we have the age distribution in individuals for a simple random sample of 4500 New Yorkers in 2010. At a = 0.03, you will need to test if the New York sample's age distribution is the same as the U.S. overall age distribution in 2010. (a)[1] Form the null and alternative hypotheses Ho and H₁. Make a sketch of the test. (b)[1] Specify appropriate equations for the x² statistic and degrees of freedom df. (c)[1] Based on the U.S. overall age distribution, calculate expected frequencies. (d) [2] Given the expected and observed frequencies, calculate the x² statistic and its df. (e) [1] Given a = 0.03 and df, use CHISQ.INV(**) to look up for the critical value x²*. (f)[2] Compare x² statistic with x²* critical to reject or accept Ho. Interpret your result. (g)[2] Sketch and find the p-value of the test. Comment on the p-value and its implication. Whole US (%) NY Sample (People) 6.54% 6.59% 6.70% 7.14% 6.99% 6.83% 6.47% 6.54% Age Range Under 5 years 5 to 9 years 10 to 14 years 15 to 19 years 20 to 24 years 25 to 29 years 30 to 34 years 35 to 39 years 40 to 44 years 45 to 49 years 50 to 54 years 55 to 59 years 60 to 64 years 65 to 69 years 70 to 74 years 75 to 79 years 80 to 84 years 85 years and over TOTAL 0.99 2.66838 df 17 CHISQ.INV(a*,df) 33.40866 CHISQ.DIST(x²*,df,1) 0.00003 6.77% 7.36% 7.22% 6.37% 5.45% 4.03% 3.01% 2.37% 1.86% 1.76% 100.00% 0.97 5.33675 18 30.84473 0.00177 0.97 7.28600 17 29.52268 0.02047 268 270 281 317 328 321 297 291 315 339 330 287 248 180 136 110 91 91 4500 0.95 10.67350 18 28.86930 0.09231 0.90 10.67350 17 24.76904 0.12698 We have the age distribution in percentages for the whole United States according to the 2010 US Census in the following table. Besides, we have the age distribution in individuals for a simple random sample of 4500 New Yorkers in 2010. At a = 0.03, you will need to test if the New York sample's age distribution is the same as the U.S. overall age distribution in 2010. (a)[1] Form the null and alternative hypotheses Ho and H₁. Make a sketch of the test. (b)[1] Specify appropriate equations for the x² statistic and degrees of freedom df. (c)[1] Based on the U.S. overall age distribution, calculate expected frequencies. (d) [2] Given the expected and observed frequencies, calculate the x² statistic and its df. (e) [1] Given a = 0.03 and df, use CHISQ.INV(**) to look up for the critical value x²*. (f)[2] Compare x² statistic with x²* critical to reject or accept Ho. Interpret your result. (g)[2] Sketch and find the p-value of the test. Comment on the p-value and its implication. Whole US (%) NY Sample (People) 6.54% 6.59% 6.70% 7.14% 6.99% 6.83% 6.47% 6.54% Age Range Under 5 years 5 to 9 years 10 to 14 years 15 to 19 years 20 to 24 years 25 to 29 years 30 to 34 years 35 to 39 years 40 to 44 years 45 to 49 years 50 to 54 years 55 to 59 years 60 to 64 years 65 to 69 years 70 to 74 years 75 to 79 years 80 to 84 years 85 years and over TOTAL 0.99 2.66838 df 17 CHISQ.INV(a*,df) 33.40866 CHISQ.DIST(x²*,df,1) 0.00003 6.77% 7.36% 7.22% 6.37% 5.45% 4.03% 3.01% 2.37% 1.86% 1.76% 100.00% 0.97 5.33675 18 30.84473 0.00177 0.97 7.28600 17 29.52268 0.02047 268 270 281 317 328 321 297 291 315 339 330 287 248 180 136 110 91 91 4500 0.95 10.67350 18 28.86930 0.09231 0.90 10.67350 17 24.76904 0.12698
Expert Answer:
Answer rating: 100% (QA)
a The null hypothesis Ho is that the New York samples age distribution is the same as the US overall age distribution in 2010 The alternative hypothes... View the full answer
Related Book For
Statistics Unlocking the Power of Data
ISBN: 978-1118583104
1st edition
Authors: Robin H. Lock, Patti Frazer Lock, Kari Lock Morgan, Eric F. Lock, Dennis F. Lock
Posted Date:
Students also viewed these mathematics questions
-
ChiSq Take a simple random sample of size 40 from the ChiSq data file. a. Create a bootstrap distribution of the mean ( or use the distribution you created in Question 22). Calculate a 95% bootstrap...
-
You take a simple random sample of size 10 from Population1 and a simple random sample of size 12 from Population 2. The mean of the first sample is 150; the sample standard deviation is 25. The mean...
-
You take a simple random sample of size 8 from Population1 and a simple random sample of size 12 from Population 2. The mean of the first sample is 24; the sample standard deviation is 4. The mean of...
-
Assume Pelican Corp has a current Beta is 0.65 and no debt. Management wants to increase their debt load which will result in a debt/equity ratio of 0.20 Given this change, what is the new,...
-
Redo Problem 14.12 with the following additional information. The old machine has been fully depreciated. The new machine will be depreciated under a three-year MACRS class. The marginal tax rate...
-
Critically analyse the arguments made in the article and assess whether there should be any changes made to IAS 38 as a result.
-
Consider a fully developed flow of water in a smooth pipe of diameter \(15 \mathrm{~cm}\) at a flow rate of \(0.006 \mathrm{~m}^{3} / \mathrm{s}\). The pressure drop can be calculated by the Blasius...
-
Comparative financial statement data for Duran Corporation and Kiepert Corporation, two competitors, appear below. All balance sheet data are as of December 31, 2012. Instructions(a) Comment on the...
-
Wantaby Ltd. is extending its credit terms from 45 to 60 days. Sales are expected to increase from $471 million to $5.81 million as a result Wontaby finances short-term assets at the bank at a cost...
-
Preparing Closing Journal Entries The following selected accounts appear in The GAP Inc.'s financial statements for the fiscal year ended February 2, 2019. $ millions Debit Sales Credit $16,580 Cost...
-
A combustion chamber consists of tubular combustor of constant area. Compressed air enters the tube at static temperature of 300 K, static pressure of 1 atm and a Mach number of 3.0. The heat added...
-
It is often said that public service employees are unmotivated to perform their duties. They are just interested in job security and the retirement benefits. The Honolulu Police Department is plagued...
-
Explore the issue 1. Should marijuana be legalized? 2. Should we increase taxes on the richest 1 percent of Americans to fund government programs to help middle-class households? 3. Should developers...
-
Federal law outlawing a combination of interests such as a trust or a conspiracy that attempts to unreasonably constrain trade among states or with foreign nations. Significance: The Supreme Court,...
-
Based on your experiences what do you think about infants and toddlers? Infants and toddlers are a unique age group, how do you expect them to interact with each other? With adults? With the...
-
Read the Articles: " Bitcoin Barely Budges After Jobs Report. 'A Big Round of Volatility' May Still Be Ahead Actions ." by Barron's (Click on the link posted) and " This year may be pivotal for the...
-
The pressure in a container is 52 kPa. If this pressure is measured using a manometer (U-tube) with one end exposed to atmospheric pressure (101.325 kPa), and is filled with a substance having...
-
Revol Industries manufactures plastic bottles for the food industry. On average, Revol pays $76 per ton for its plastics. Revol's waste-disposal company has increased its waste-disposal charge to $57...
-
Use the probability function given in the table to calculate: (a) The mean of the random variable (b) The standard deviation of the random variable 12 10 16 14 p(x) 0.25 0.25 0.25 0.25
-
Give null and alternative hypotheses for a population proportion, as well as sample results. Use StatKey or other technology to generate a randomization distribution and calculate a p-value. StatKey...
-
Table 11.3 gives probabilities for various combinations of events A, B, and their complements. Table 11.3 Are events A and B independent? not A 0.4 B 0.2 not B 0.1 0.3
-
The codon change (Gly-12 to Val-12) in human H-ras that converts it to oncogenic H-ras has been associated with many types of cancers. For this reason, researchers would like to develop drugs to...
-
Outline the general strategy used in metagenomics.
-
You need to understand the approach described in question 3 in More Genetic TIPS before answering this question. A muscle-specific gene was cloned and then subjected to promoter bashing. As shown...
Study smarter with the SolutionInn App