

Question: We have two projects: project A and project B. A 10% cost of capital and 10-year projects. Assume that the financial manager created three scenarios
We have two projects: project A and project B.
A 10% cost of capital and 10-year projects.
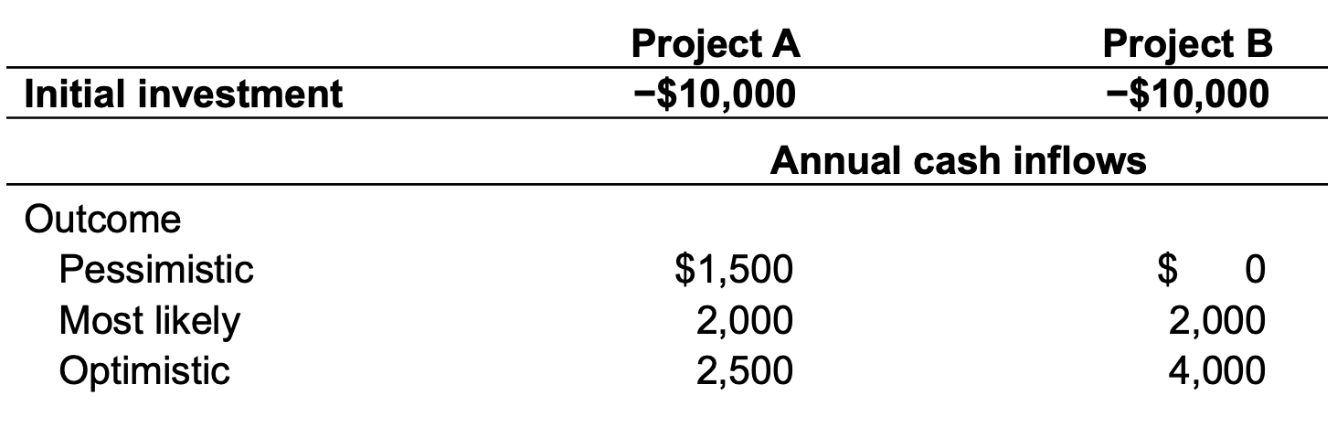
Assume that the financial manager created three scenarios for each project: pessimistic, most likely, and optimistic. The table below summarizes the cash inflows
Calculate the NPV for each of the three scenarios for each project.
Calculate the range of cash inflows.
Calculate the NPV ranges.
\begin{tabular}{|c|c|c|} \hline & Project A & Project B \\ \hline Initial investment & $10,000 & $10,000 \\ \hline & \multicolumn{2}{|c|}{ Annual cash inflows } \\ \hline \multicolumn{3}{|l|}{ Outcome } \\ \hline Pessimistic & $1,500 & $ \\ \hline Most likely & 2,000 & 2,000 \\ \hline Optimistic & 2,500 & 4,000 \\ \hline \end{tabular} \begin{tabular}{|c|c|c|} \hline & Project A & Project B \\ \hline Initial investment & $10,000 & $10,000 \\ \hline & \multicolumn{2}{|c|}{ Annual cash inflows } \\ \hline \multicolumn{3}{|l|}{ Outcome } \\ \hline Pessimistic & $1,500 & $ \\ \hline Most likely & 2,000 & 2,000 \\ \hline Optimistic & 2,500 & 4,000 \\ \hline \end{tabular}
Step by Step Solution
There are 3 Steps involved in it

Get step-by-step solutions from verified subject matter experts