

Question: WE MUST CREATE A PIVOT TABLE TO VISUALIZE THE DISTRIBUTION OF TRIPS BY USER TYPE AND MUST INTERPRET THE CHART BASED ON THESE INFORMATIONS BELOW:
WE MUST CREATE A PIVOT TABLE TO VISUALIZE THE DISTRIBUTION OF TRIPS BY USER TYPE AND MUST INTERPRET THE CHART BASED ON THESE INFORMATIONS BELOW:
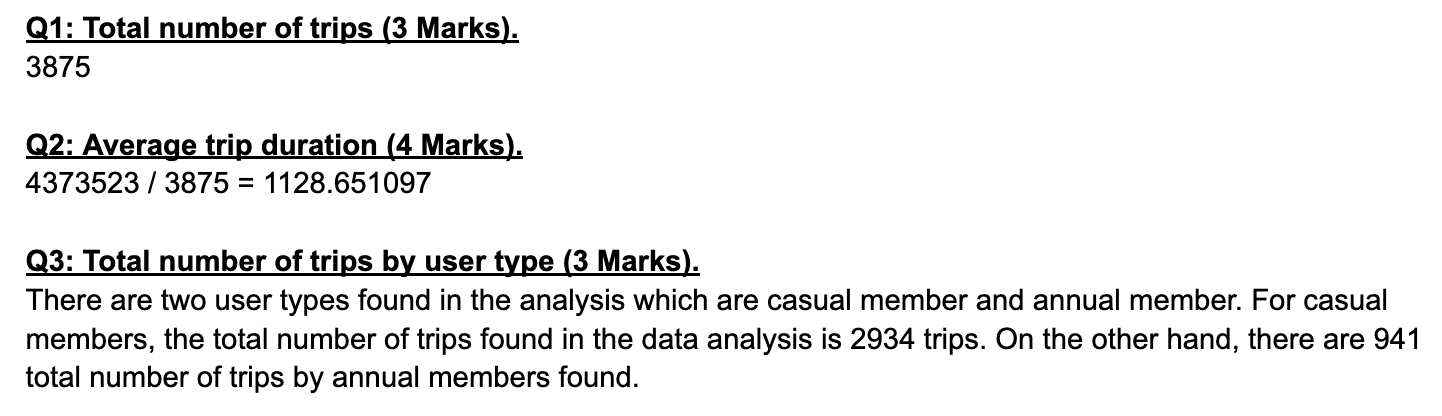
Q1: Total number of trips (3 Marks). 3875 Q2: Average trip duration (4 Marks}. 437352313875 = 1128.651097 Q3: Total number of trips by user mpe [3 Marks). There are two user types found in the analysis which are casual member and annual member. For casual members, the total number of trips found in the data analysis is 2934 trips. On the other hand, there are 941 total number of trips by annual members found
Step by Step Solution
There are 3 Steps involved in it
1 Expert Approved Answer
Step: 1 Unlock

Question Has Been Solved by an Expert!
Get step-by-step solutions from verified subject matter experts
Step: 2 Unlock
Step: 3 Unlock