

Question: We often aggregate data in SQL, Excel and other environments. Aggregated data can provide insights, but these aggregated insights must be studied with care. Take
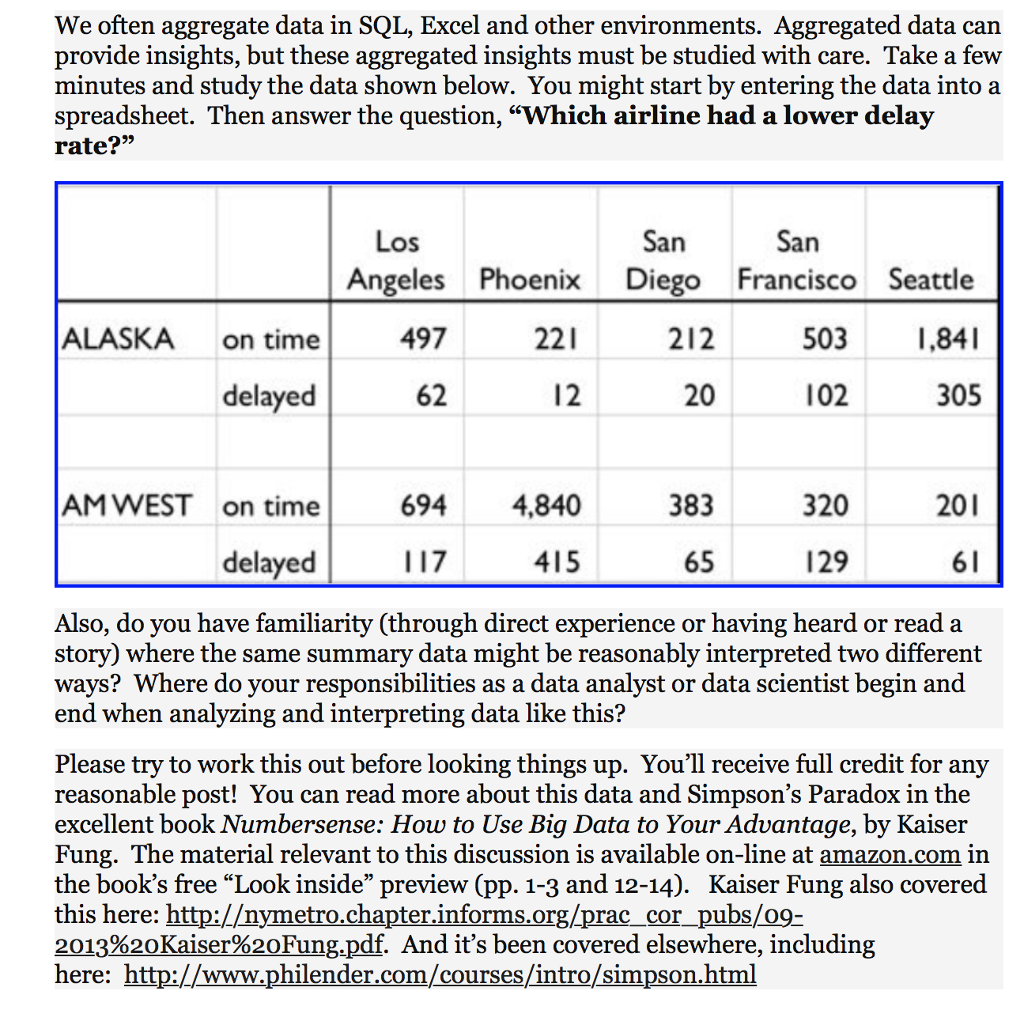
We often aggregate data in SQL, Excel and other environments. Aggregated data can provide insights, but these aggregated insights must be studied with care. Take a few minutes and study the data shown below. You might start by entering the data into a spreadsheet. Then answer the question, "Which airline had a lower delay rate?" LOS San San Angeles Phoenix Diego Francisco Seattle 1,841 305 ALASKA on time 497 22I 212 503 delaye 62 20 102 AM WEST on tim 694 4,840 383 320 201 delaye 415 65 129 Also, do you have familiarity (through direct experience or having heard or read a story) where the same summary data might be reasonably interpreted two different ways? Where do your responsibilities as a data analyst or data scientist begin and end when analyzing and interpreting data like this? Please try to work this out before looking things up. You'll receive full credit for any reasonable post! You can read more about this data and Simpson's Paradox in the excellent book Numbersense: How to Use Big Data to Your Advantage, by Kaiser Fung. The material relevant to this discussion is available on-line at amazon.com in the book's free "Look inside" preview (pp. 1-3 and 12-14). Kaiser Fung also covered this here: http:/ymetro.chapter.informs.org/prac_cor pubs/09- 2013%20Kaiser%20Fung.pdf. And it's been covered elsewhere, including here: http://www.philender.com/courses/intro/simpson.html We often aggregate data in SQL, Excel and other environments. Aggregated data can provide insights, but these aggregated insights must be studied with care. Take a few minutes and study the data shown below. You might start by entering the data into a spreadsheet. Then answer the question, "Which airline had a lower delay rate?" LOS San San Angeles Phoenix Diego Francisco Seattle 1,841 305 ALASKA on time 497 22I 212 503 delaye 62 20 102 AM WEST on tim 694 4,840 383 320 201 delaye 415 65 129 Also, do you have familiarity (through direct experience or having heard or read a story) where the same summary data might be reasonably interpreted two different ways? Where do your responsibilities as a data analyst or data scientist begin and end when analyzing and interpreting data like this? Please try to work this out before looking things up. You'll receive full credit for any reasonable post! You can read more about this data and Simpson's Paradox in the excellent book Numbersense: How to Use Big Data to Your Advantage, by Kaiser Fung. The material relevant to this discussion is available on-line at amazon.com in the book's free "Look inside" preview (pp. 1-3 and 12-14). Kaiser Fung also covered this here: http:/ymetro.chapter.informs.org/prac_cor pubs/09- 2013%20Kaiser%20Fung.pdf. And it's been covered elsewhere, including here: http://www.philender.com/courses/intro/simpson.html
Step by Step Solution
There are 3 Steps involved in it

Get step-by-step solutions from verified subject matter experts