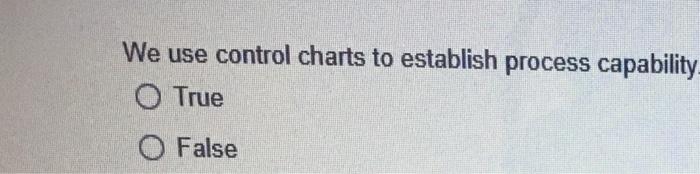
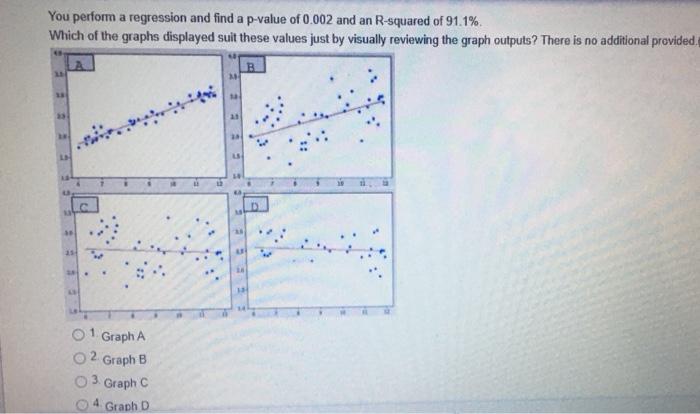
Question: We use control charts to establish process capability O True O False You perform a regression and find a p-value of 0.002 and an R-squared

We use control charts to establish process
We use control charts to establish process capability O True O False You perform a regression and find a p-value of 0.002 and an R-squared of 91.1% Which of the graphs displayed suit these values just by visually reviewing the graph outputs? There is no additional provided. B M 15 O 1 Graph A Graph B Graph C 4 Graph D You have done a regression analysis to study the effect of an X onto the CTQ. The result is displayed below. Which is not true? See results below, before you answer this question (1 point) Regression Analysis: CTQ versus X The regression equation is CTQ -0.65 + 0.70 X S - 1.40 R-S - 34.89 R-Sq(adj) = 32.5 Analysis of Variance Source DE SS Regression 1 29.1469 Error 28 54.5010 Total 29 83.6478 MS 29.1469 1.9465 F 14.9743 0.001 0 1 The predicted value for X = 6 equals CTQ = 4.85. O2 For fixed X, the CTQ has a standard deviation of about 1.40. O 3 The model gives precise predictions about the CTQ O4 X has a significant effect on the CTQ. f you want to test the claim that the mean time between failures of a particular piece of equipment has increased from 207.1 operating hours, what would your alternative hypothesis be?(1 point) 1. mean 2071 mean> 2071 4 mean=207.1

Step by Step Solution

There are 3 Steps involved in it

1 Expert Approved Answer
Step: 1 Unlock blur-text-image
Question Has Been Solved by an Expert!

Get step-by-step solutions from verified subject matter experts

Step: 2 Unlock
Step: 3 Unlock

Students Have Also Explored These Related General Management Questions!