

Question: We walked through the two cases (slide 2 versus slide 3) and demonstrated that at the same 20% growth (and the same assumption that Debt-Equity
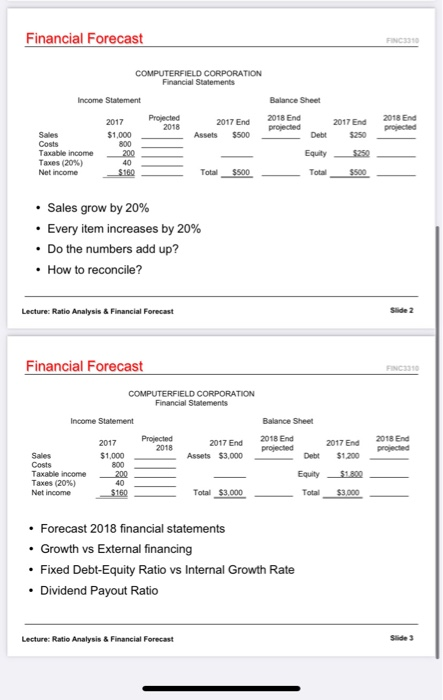
Financial Forecast FINCS COMPUTERFIELD CORPORATION Financial Statements Income Statement 2017 Projected 2018 2017 End Sales $1,000 Assets $500 Costs 800 Taxable income 200 Taxes (20%) 40 Net income $160 Total Balance Sheet 2018 End projected Debt Equity Total 2017 End $250 2018 End projected $500 5500 Sales grow by 20% Every item increases by 20% Do the numbers add up? How to reconcile? Lecture: Ratio Analysis & Financial Forecast Slide 2 Financial Forecast FNC10 COMPUTERFIELD CORPORATION Financial Statements Income Statement Projected 2018 Balance Sheet 2018 End projected 2017 End Assets $3,000 2017 End $1.200 2018 End projected Sales Costs Taxable income Taxes (20%) Net income 2017 $1,000 800 200 40 $160 Equity $1.809 Total $3.000 Total $3.000 Forecast 2018 financial statements Growth vs External financing Fixed Debt-Equity Ratio vs Internal Growth Rate Dividend Payout Ratio Lecture: Ratio Analysis & Financial Forecast Slide 3 Financial Forecast FINCS COMPUTERFIELD CORPORATION Financial Statements Income Statement 2017 Projected 2018 2017 End Sales $1,000 Assets $500 Costs 800 Taxable income 200 Taxes (20%) 40 Net income $160 Total Balance Sheet 2018 End projected Debt Equity Total 2017 End $250 2018 End projected $500 5500 Sales grow by 20% Every item increases by 20% Do the numbers add up? How to reconcile? Lecture: Ratio Analysis & Financial Forecast Slide 2 Financial Forecast FNC10 COMPUTERFIELD CORPORATION Financial Statements Income Statement Projected 2018 Balance Sheet 2018 End projected 2017 End Assets $3,000 2017 End $1.200 2018 End projected Sales Costs Taxable income Taxes (20%) Net income 2017 $1,000 800 200 40 $160 Equity $1.809 Total $3.000 Total $3.000 Forecast 2018 financial statements Growth vs External financing Fixed Debt-Equity Ratio vs Internal Growth Rate Dividend Payout Ratio Lecture: Ratio Analysis & Financial Forecast Slide 3
Step by Step Solution
There are 3 Steps involved in it

Get step-by-step solutions from verified subject matter experts